Inferring cases from recent deaths
The published article is available here
Aim
To infer the number of cases of COVID-19 based on recent deaths.
Key findings
By the time a COVID-19 death is reported in a newly affected country, it is likely that there are already hundreds or thousands of cases in the population. This means containment through contact tracing will likely be very challenging, and alternative control/mitigation strategies should probably be considered.
App
We also created an interactive tool where users can run the model themselves under different assumptions.
Summary of findings
Simulations results ran for a range of parameter combinations and for a single death are summarised in Table 1. Whilst there is substantial uncertainty in the total numbers of cases, results under most settings suggest that hundreds to thousands of cases are likely. Higher reproduction numbers (R) and lower CFR give the largest estimates. The scenario leading to fewest cases (R = 1.5, CFR = 10%), which may be pausible for deaths in elderly patients, still suggest that a few thousands of contacts (assuming a few 10s of contacts per case) would likely have to be followed in order to contain the outbreak.
| R | CFR | Average | Median | Lower 95% | Lower 50% | Upper 50% | Upper 95% |
|---|---|---|---|---|---|---|---|
| 1.5 | 1 % | 1018 | 626 | 59 | 322 | 1319 | 3631 |
| 2.0 | 1 % | 5141 | 1476 | 62 | 670 | 3619 | 30799 |
| 3.0 | 1 % | 26093 | 5238 | 201 | 1748 | 16561 | 240199 |
| 1.5 | 2 % | 472 | 298 | 32 | 151 | 584 | 2254 |
| 2.0 | 2 % | 1951 | 763 | 60 | 266 | 2023 | 12278 |
| 3.0 | 2 % | 20387 | 3662 | 287 | 1279 | 13050 | 166783 |
| 1.5 | 3 % | 300 | 192 | 25 | 100 | 382 | 1158 |
| 2.0 | 3 % | 923 | 430 | 35 | 172 | 926 | 5177 |
| 3.0 | 3 % | 47899 | 2142 | 79 | 549 | 7140 | 189223 |
| 1.5 | 10 % | 104 | 65 | 3 | 30 | 130 | 415 |
| 2.0 | 10 % | 248 | 120 | 9 | 49 | 268 | 1348 |
| 3.0 | 10 % | 4945 | 488 | 13 | 121 | 1764 | 49745 |
Table 1: summaries of the total number of cases inferred for a single death,
based on 200 simulations for each parameter combination.
Summary of the methods
Outline
For any new death, we infer the date of onset of the patient and the number of concurrent cases who survived, and use a branching process to simulate epidemic trajectories from these cases, until the present time. Large numbers of simulations are used to account for the uncertainty in delay distributions, case fatality ratio (CFR), and transmissibility.
Algorithm
A single simulation involves the following steps:
-
for each death:
1.1. draw a likely date of onset from the onset-to-death delay distribution; obtain one date of onset per death
1.2. draw the total number of concurrent cases as the sample size of a Binomial distribution with probability = CFR and 1 success
1.3. simulate several (50, by default) epidemic trajectories with a Poisson branching process using specified reproduction numbers (R) and serial interval distribution, until present time
-
add epidemic trajectories from every deaths
A typical run of our model involves several hundreds (by default, 200) simulations, which are concatenated, and from which summaries are then derived. Results from a single simulation are illustratred on the figure below.
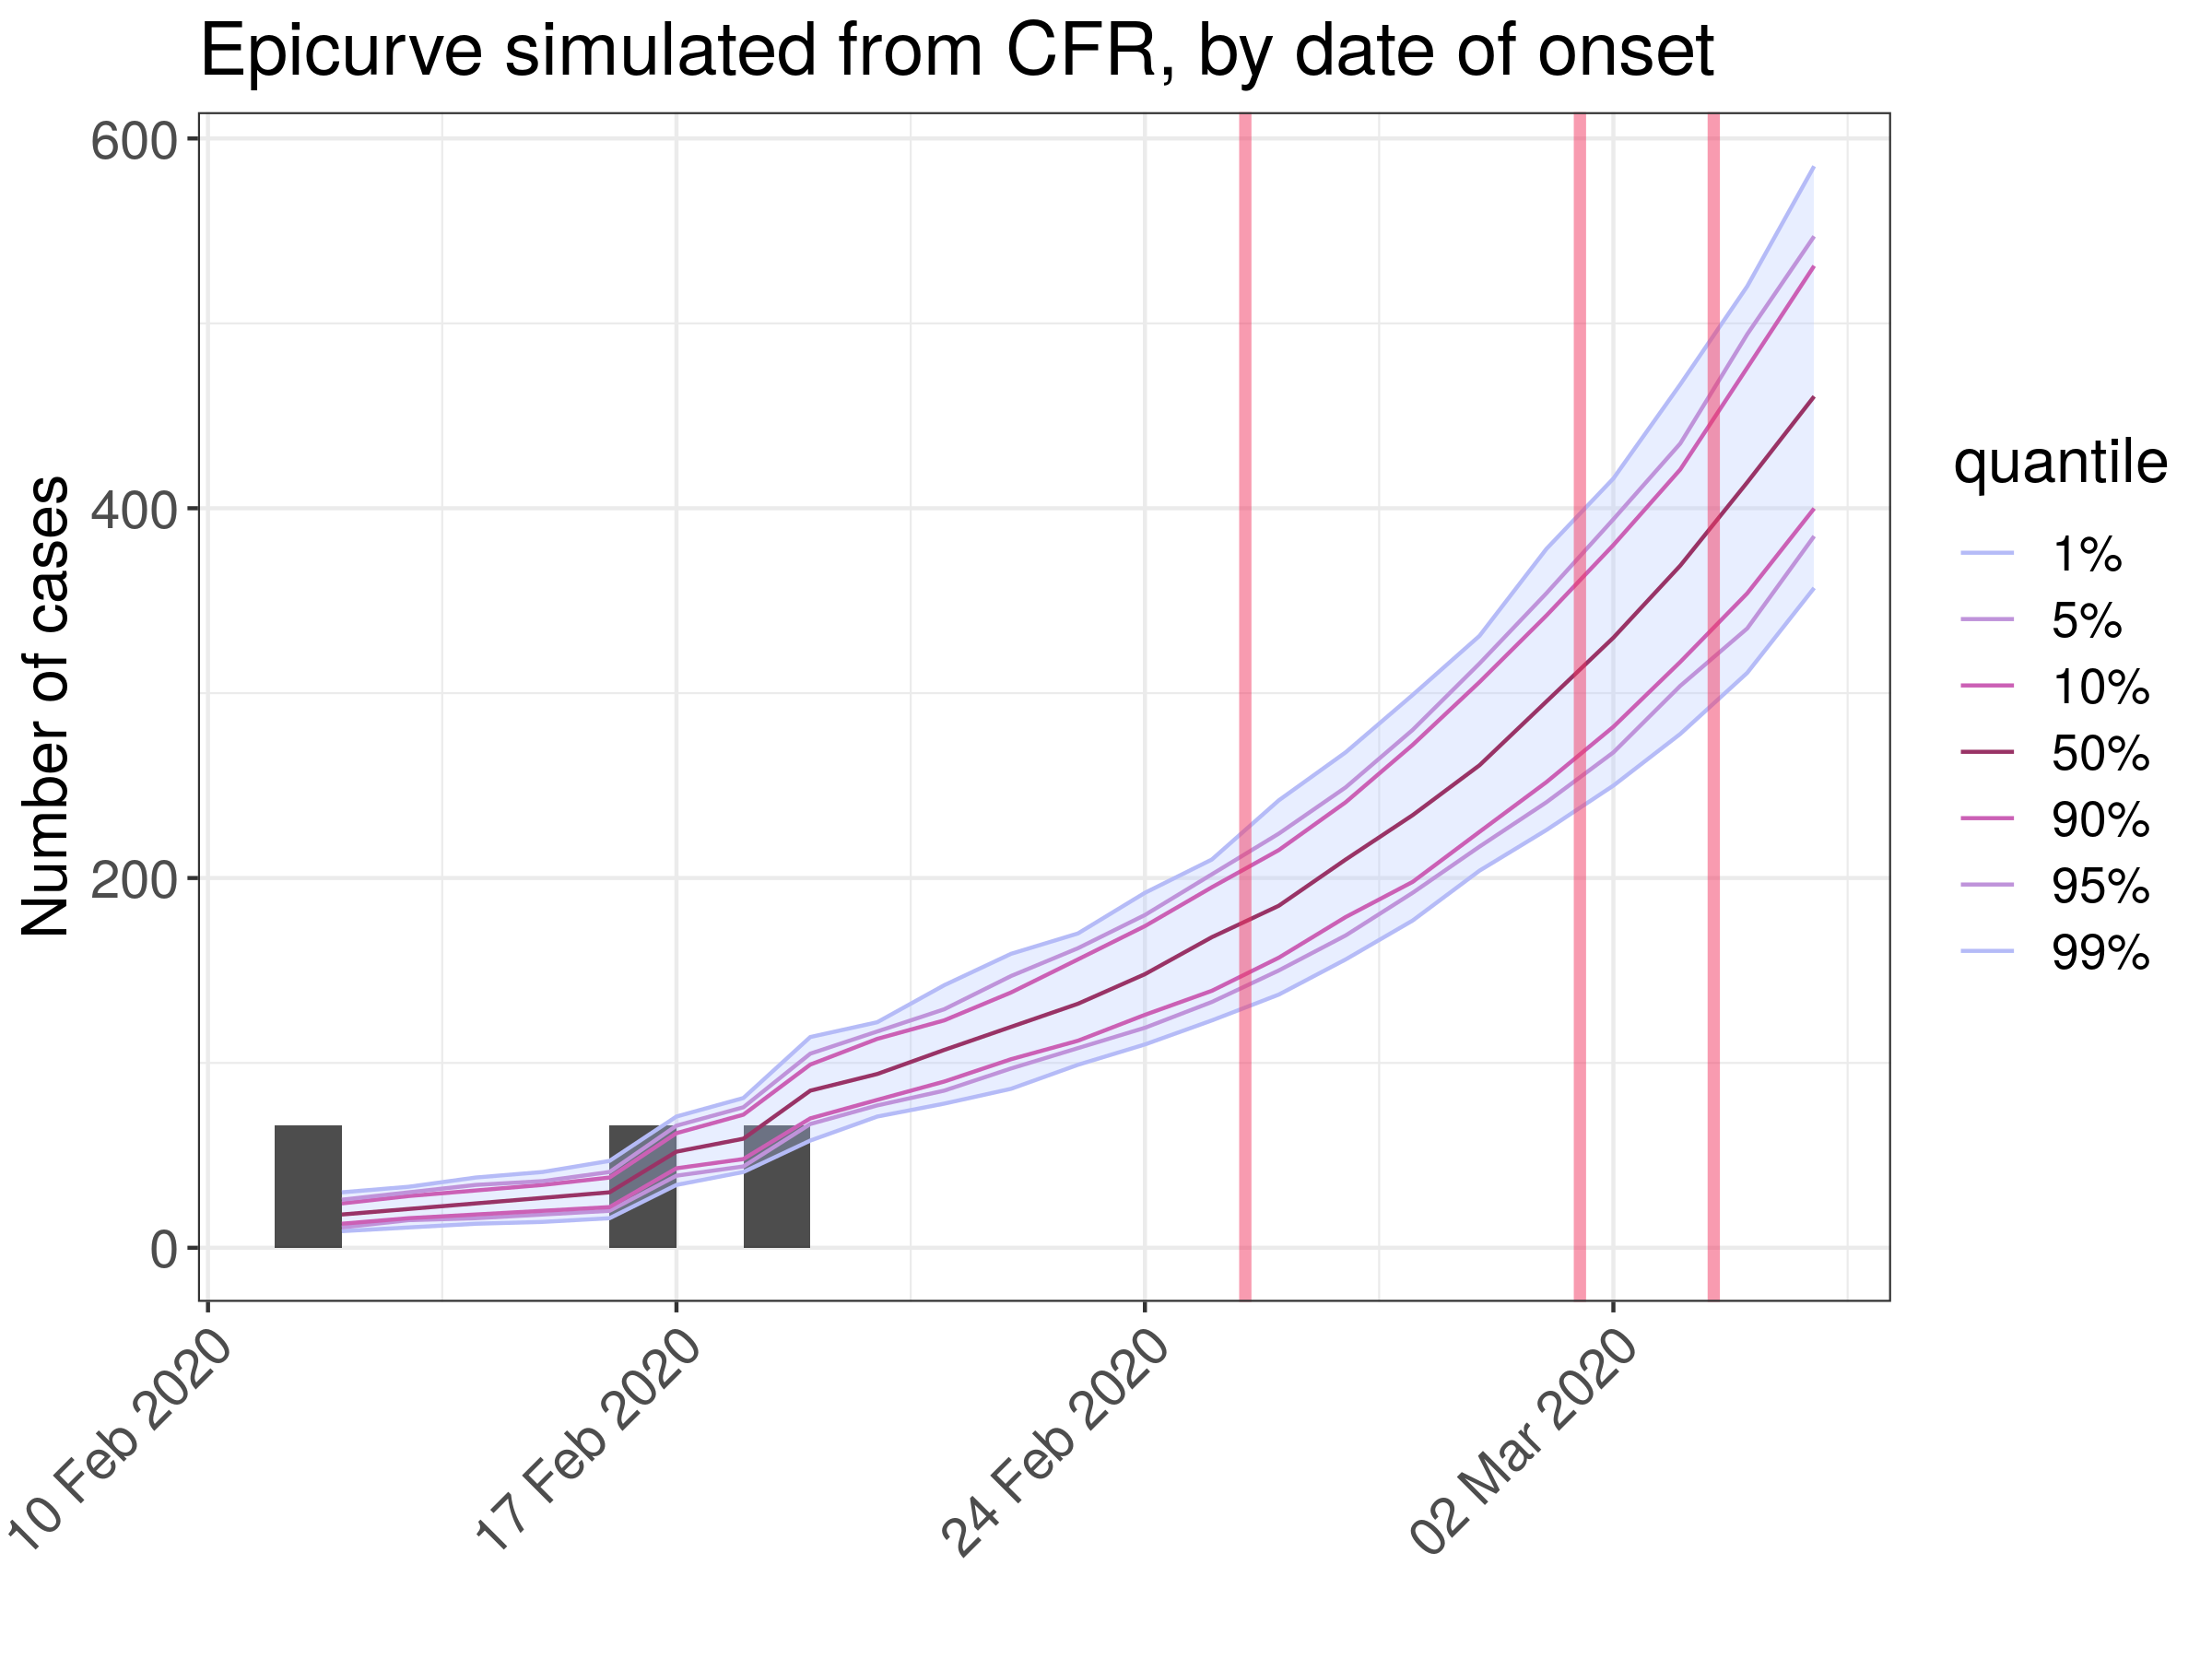
Figure 1: Example of a single simulation for 3 deaths, showing 100 epidemic
trajectories. Red lines indicate dates of deaths. Dark bars indicate the
inferred concurrent cases, placed at the inferred date of onset. The blue ribbon
and colored lines provide a visual summary of the resulting epidemic curves, in
number of new cases daily.
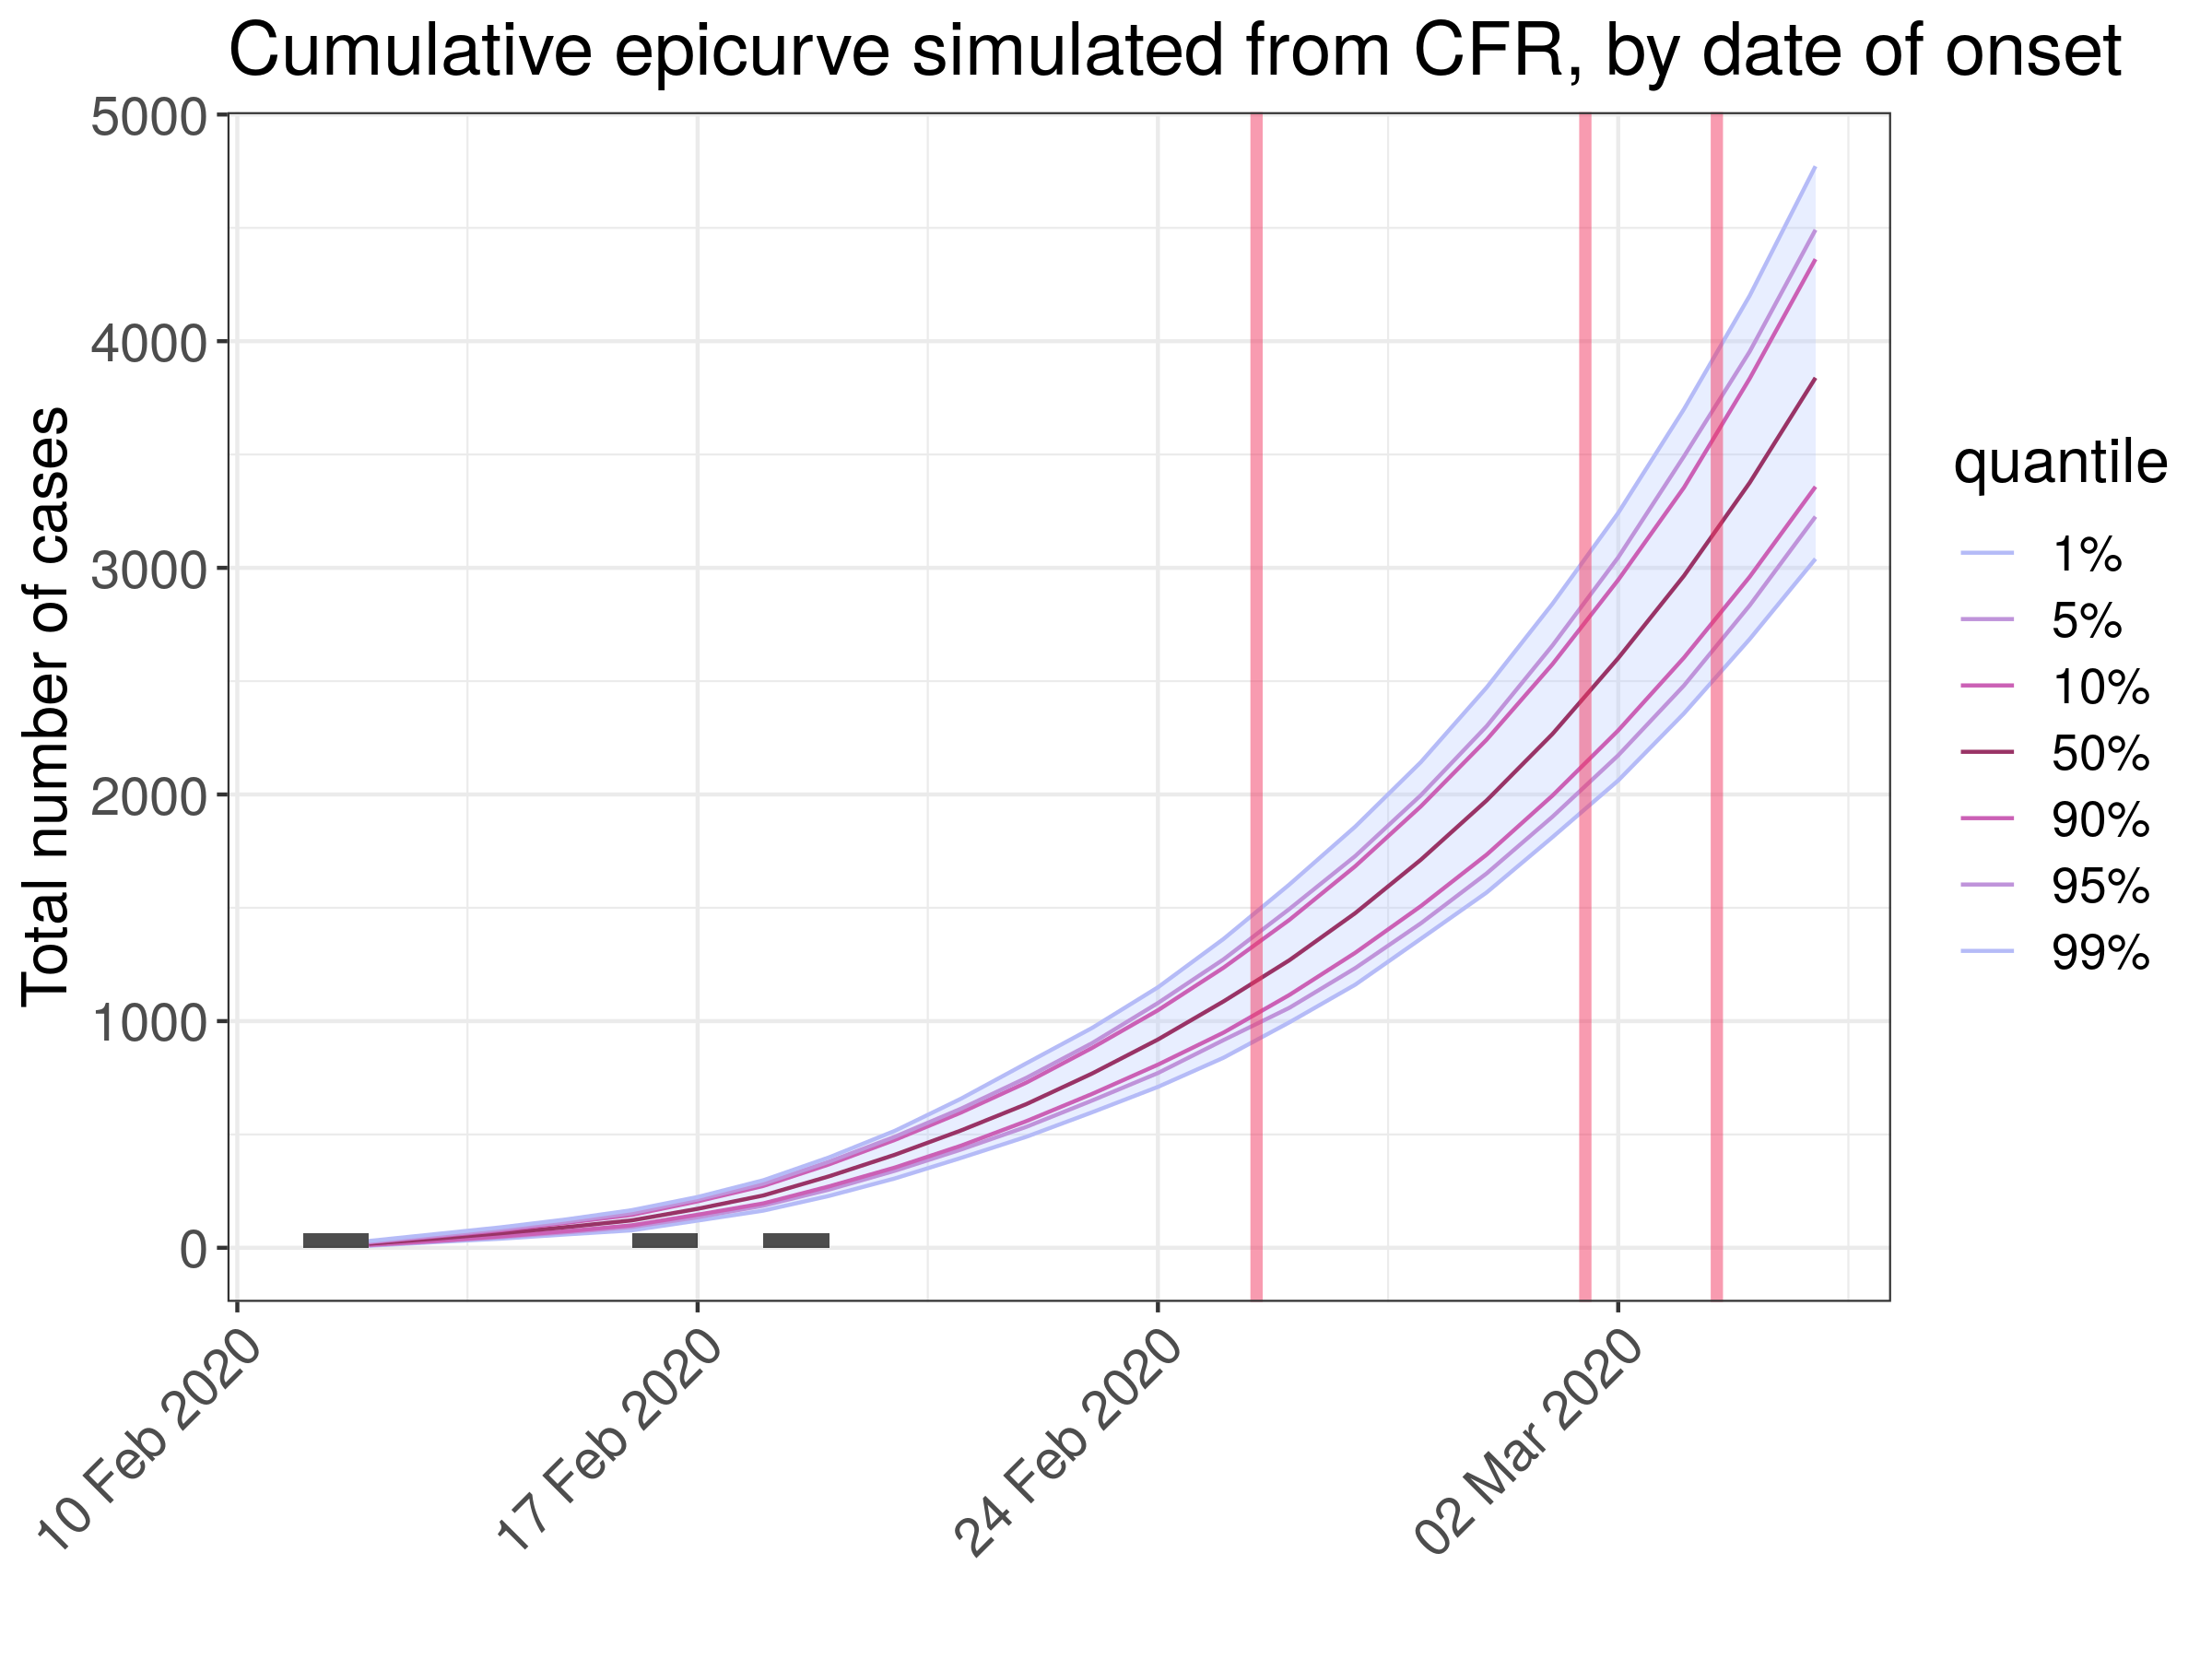
Figure 2: Example of a single simulation for 3 deaths, showing 100 epidemic
trajectories. Red lines indicate dates of deaths. Dark bars indicate the
inferred concurrent cases, placed at the inferred date of onset. The blue ribbon
and colored lines provide a visual summary of the resulting epidemic curves, in
total (cumulated) numbers cases.
Model parameters
Inputs of the model are parametrised as follows:
-
serial interval: discretised log-normal distribution with a mean of 4.7 days and a standard deviation of 2.9 days; source
-
onset-to-death distribution: discretised Gamma distribution with shape 4.726 and rate 0.3151; source
-
R: defaults to 2, in line with previous estimations, but different values are investigated in a sensitivity study (R = 1.5, 2, 3); source
-
CFR: defaults to 2%, in line with previous estimations, but different values are investigated in a sensitivity study (CFR = 1%, 2%, 3%, 10%); source
Code availability
The code implementing the model and the app is distributed under MIT license, and available from github.
Key assumptions and limitations
-
this model assumes that the death reported relates to a case infected in-country
-
this model assumes no change in transmissibility (R) over time; it is only suitable in the early stages of epidemic growth, before intervention, changes in behaviour, or the depletion of susceptibles start having a significant effect on transmission
-
the model does not account for over-dispersion in the offspring distribution which could result from super-spreading events (e.g. negative binomial distribution); this assumption can be relaxed if over-dispersion is well-characterised at some point in the future
-
in the case of multiple deaths, it is assumed that each death has been generated by a separate branching process, so that resulting cases can be added; this is unlikely to be true if death dates are far apart, in which case they could actually belong to the same branch of the transmission tree; in such situation, our model will tend to over-estimate the number of cases