Introduction
This report presents a temporal analysis of the ongoing HPAI (Highly Pathogenic Avian Influenza) outbreak affecting poultry farms in the region. The analysis covers the period from December 20, 2025 through January 13, 2026, examining epidemic curves, detection patterns, and response timelines.
Setup and Data Loading
Data Summary
This analysis includes 103 confirmed HPAI cases spanning from December 22, 2025 to January 13, 2026 (a period of 22 days).
Data completeness: 4 case(s) are missing the date of suspicion, which affects detection delay calculations for those cases. These cases were detected through methods that may not have a clear “suspicion” date (likely preshipment testing or contact tracing).
Epidemic Curves
Primary Epidemic Curve
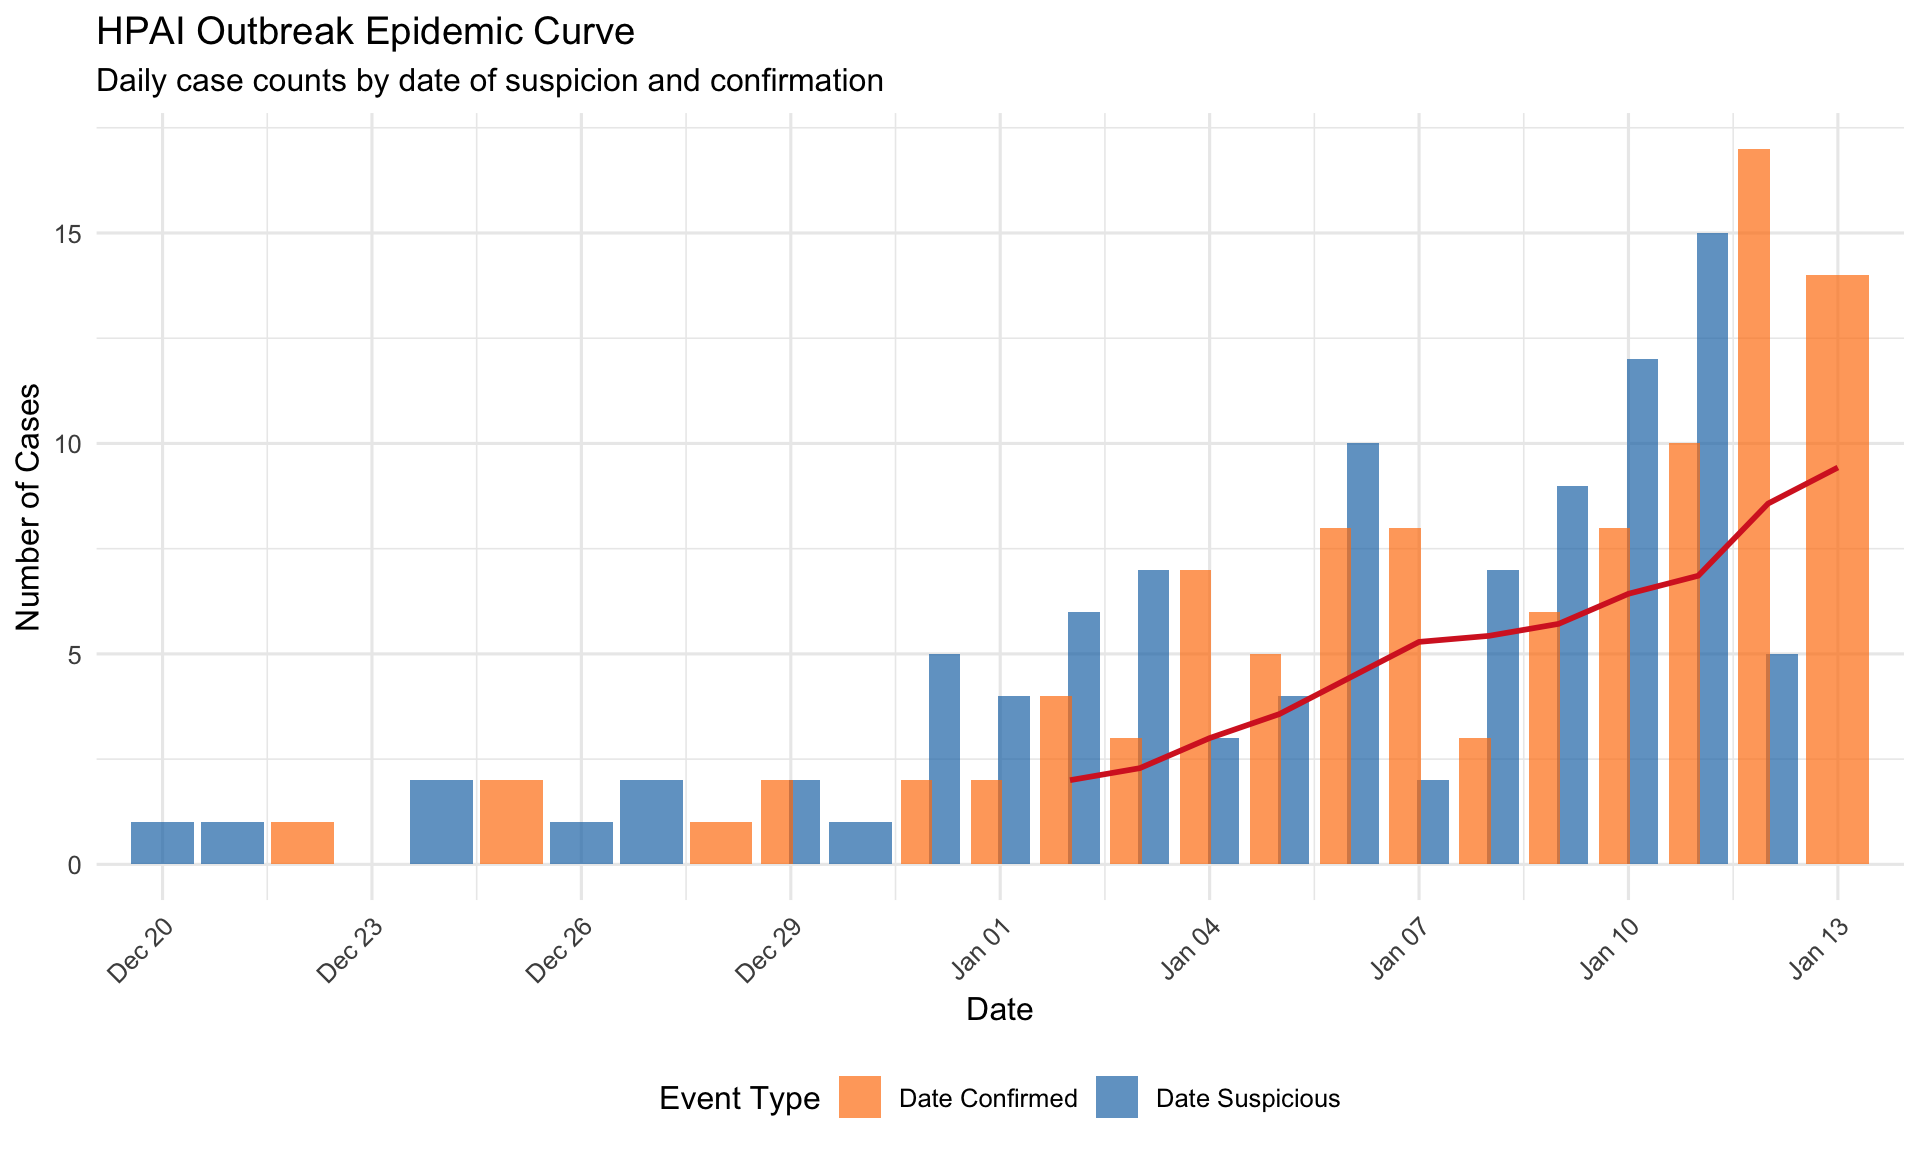
The epidemic curve shows exponential growth in the early phase of the outbreak (late December 2025), with cases detected through both passive surveillance (following clinical suspicion) and confirmation. The peak detection period occurred around January 12 with 17 cases confirmed in a single day.
The 7-day moving average indicates sustained transmission throughout the observation period, with the outbreak showing signs of continued acceleration by mid-January 2026.
Weekly Epidemic Curve
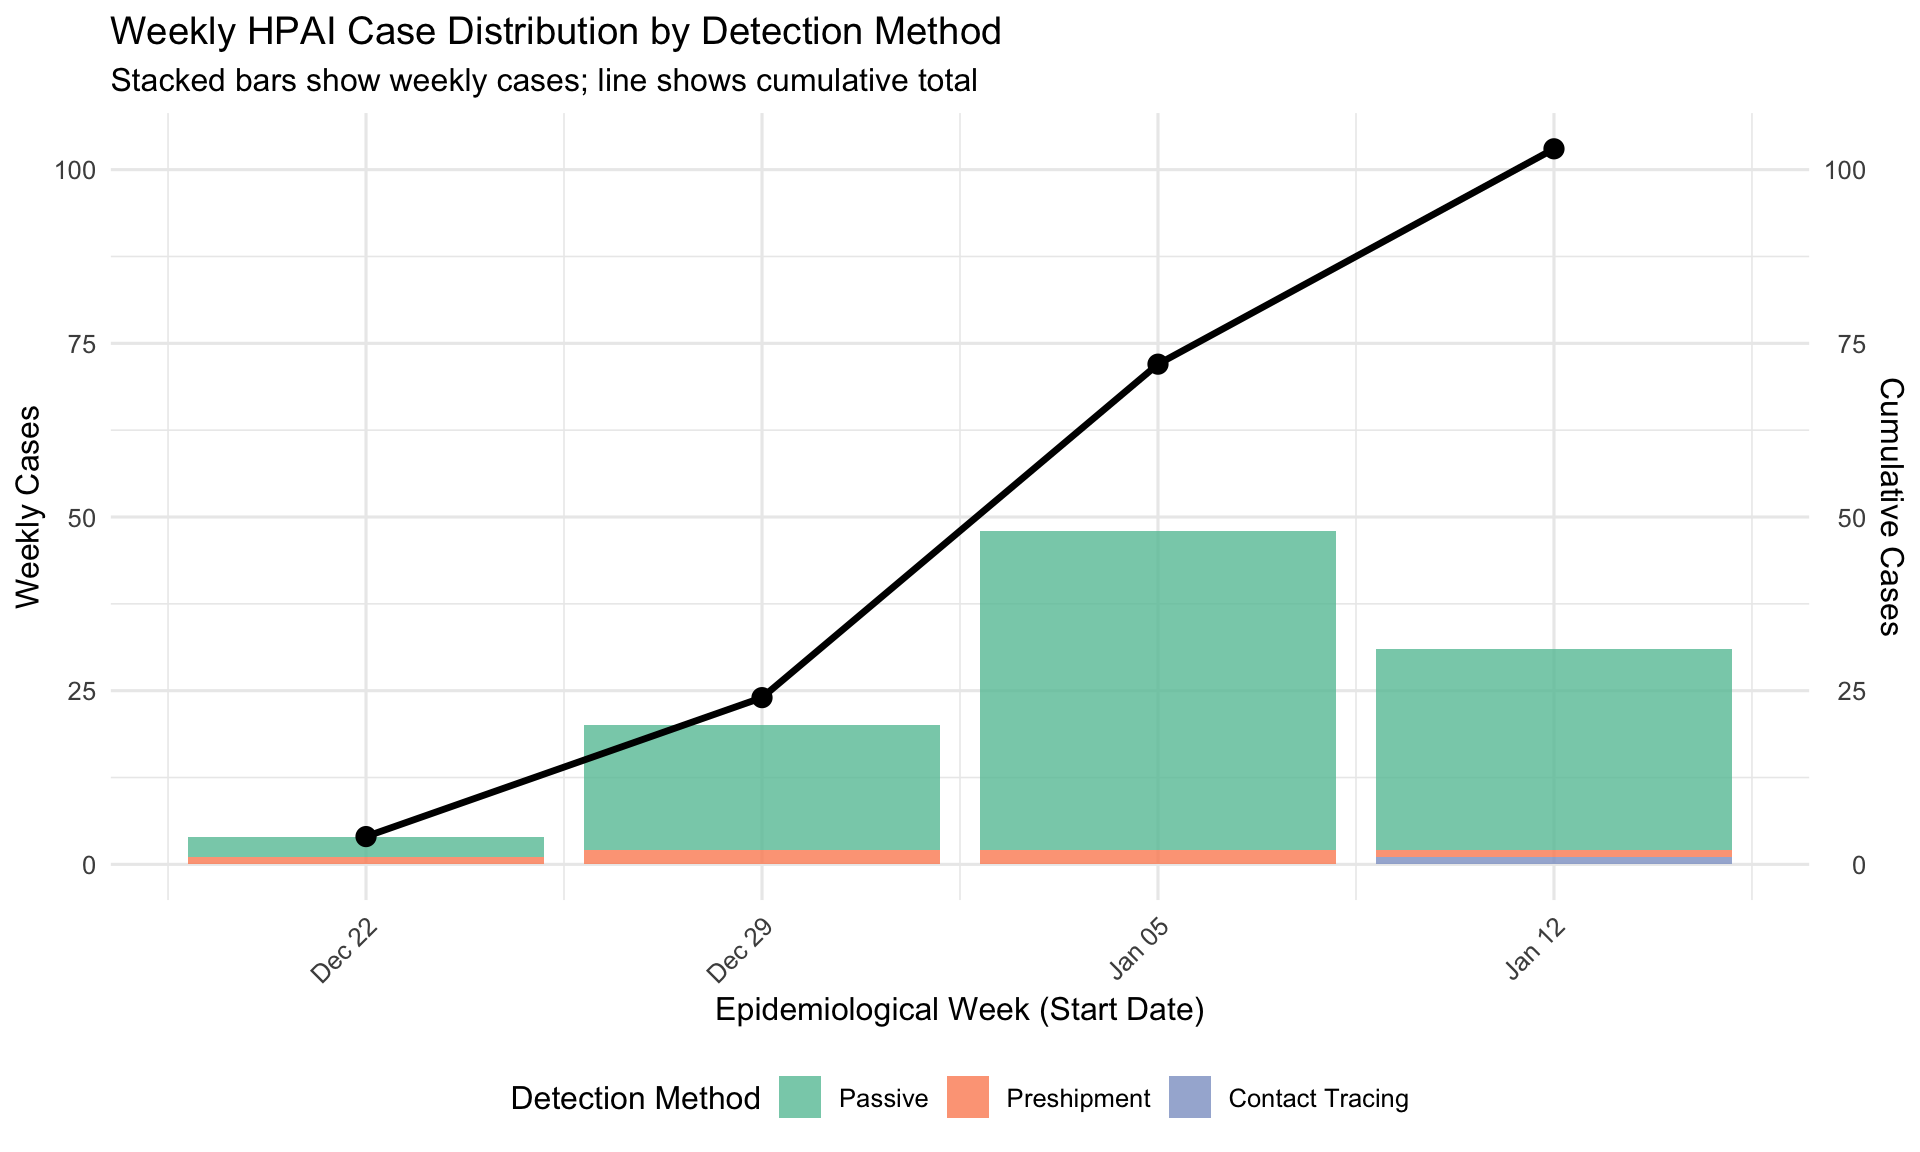
The weekly analysis reveals:
- Week 1-2 (Dec 20-Jan 2): Initial exponential growth phase with 24 cases
- Week 3 (Jan 3-9): Peak detection period with sustained high case counts
- Week 4 (Jan 10-13): Continued detection at elevated levels (incomplete week)
Growth Rate Analysis
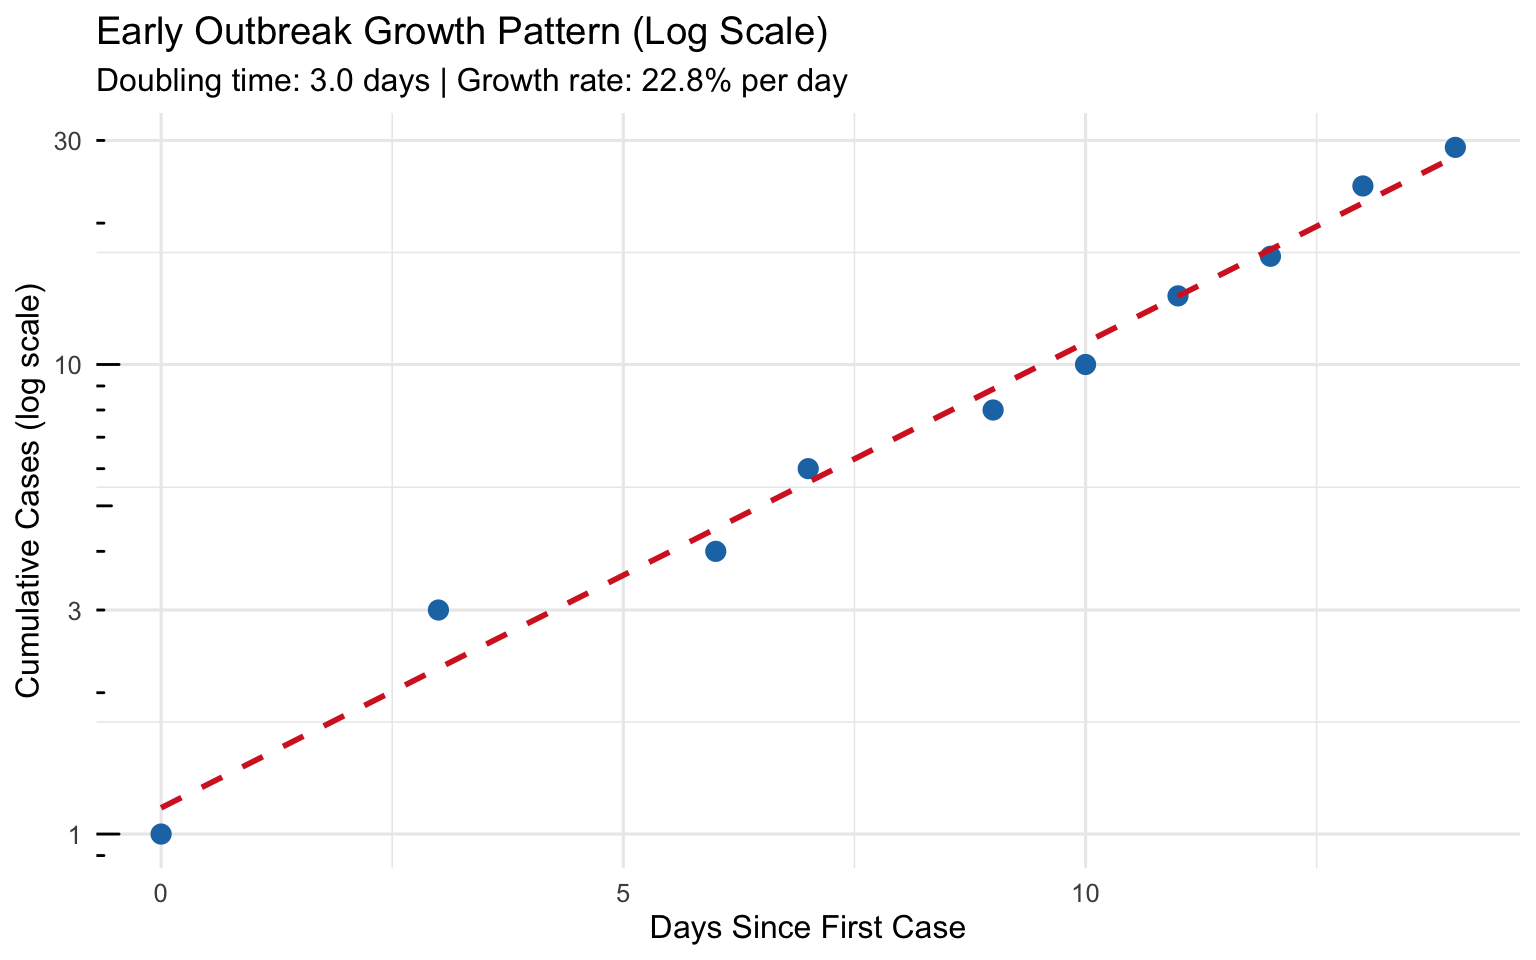
The early outbreak phase demonstrates moderate exponential growth with a doubling time of approximately 3.0 days. This growth rate is consistent with sustained transmission and suggests that control measures were needed to interrupt transmission chains.
Detection Delays
Time from Suspicion to Confirmation
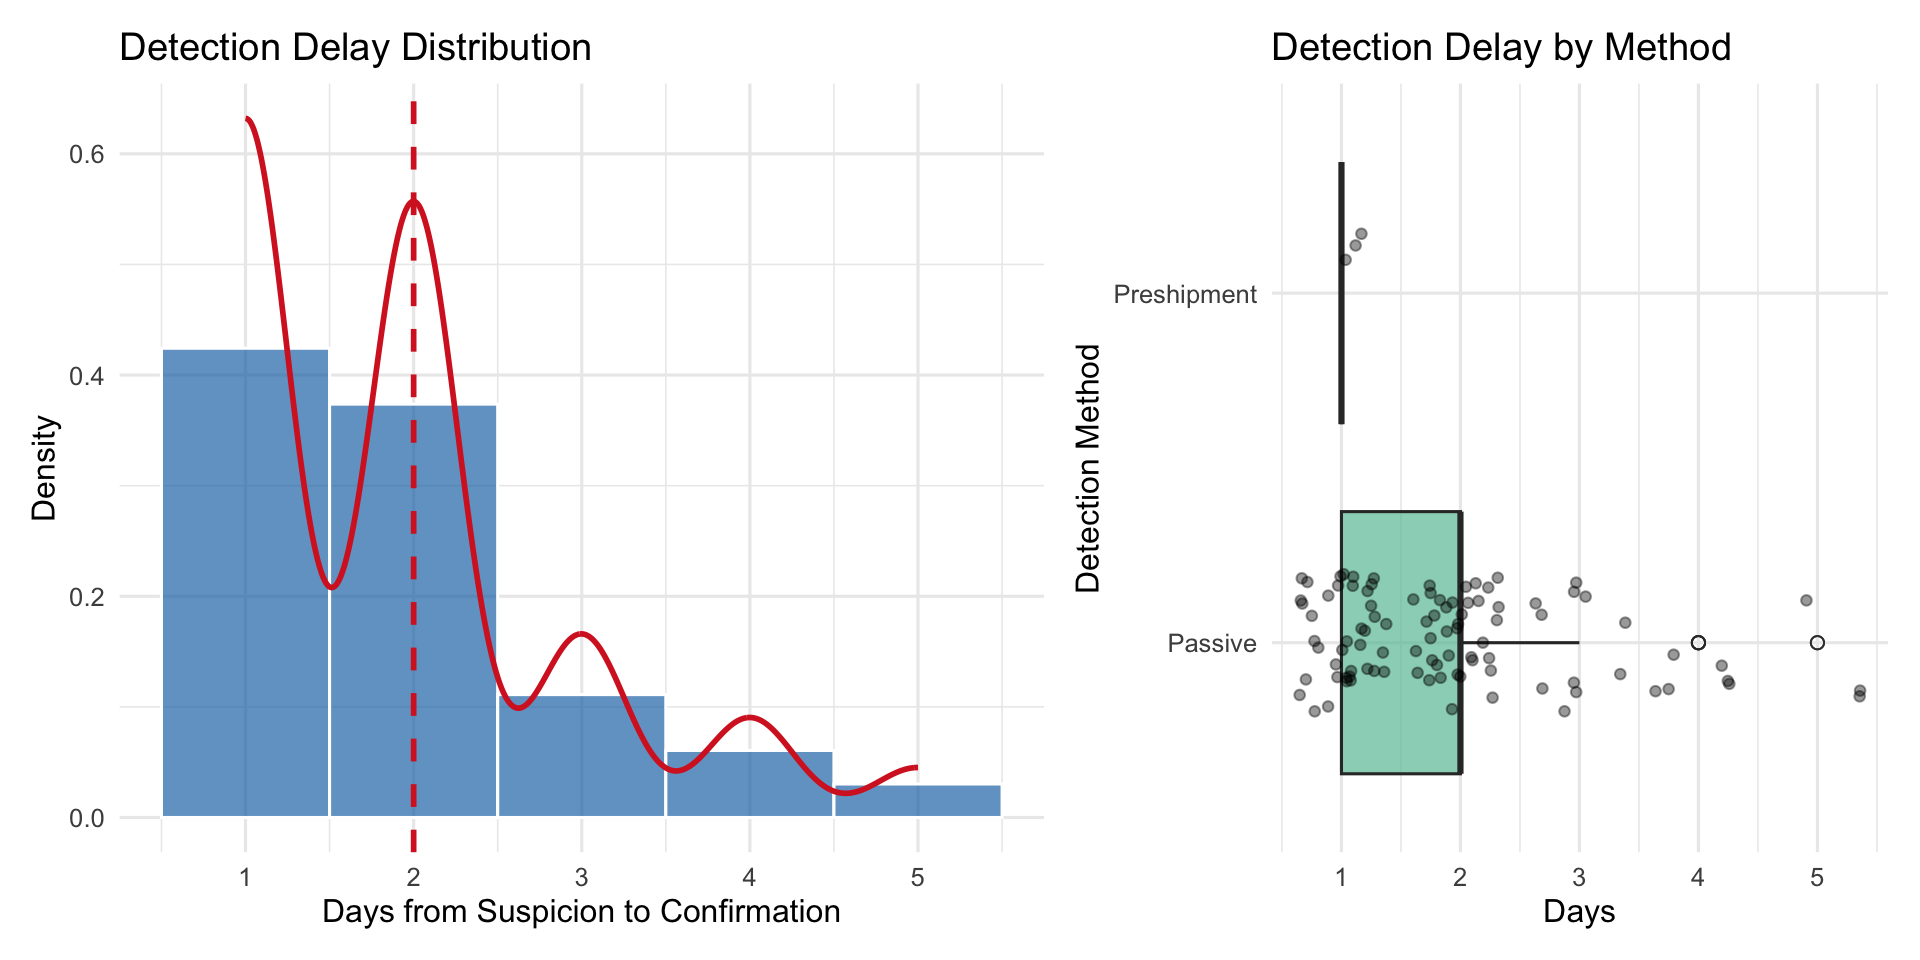
Among the 99 cases with complete date information, the time from suspicion to laboratory confirmation averaged 1.9 days (median: 2.0 days, IQR: 1.0-2.0 days).
Detection delays are generally short, reflecting efficient laboratory testing and reporting systems. The distribution shows:
- Minimum delay: 1 day(s) - indicating same-day or next-day confirmation possible
- Maximum delay: 5 days - may represent cases with initial negative results or testing delays
- Most cases (50%) confirmed within 1.0-2.0 days of suspicion
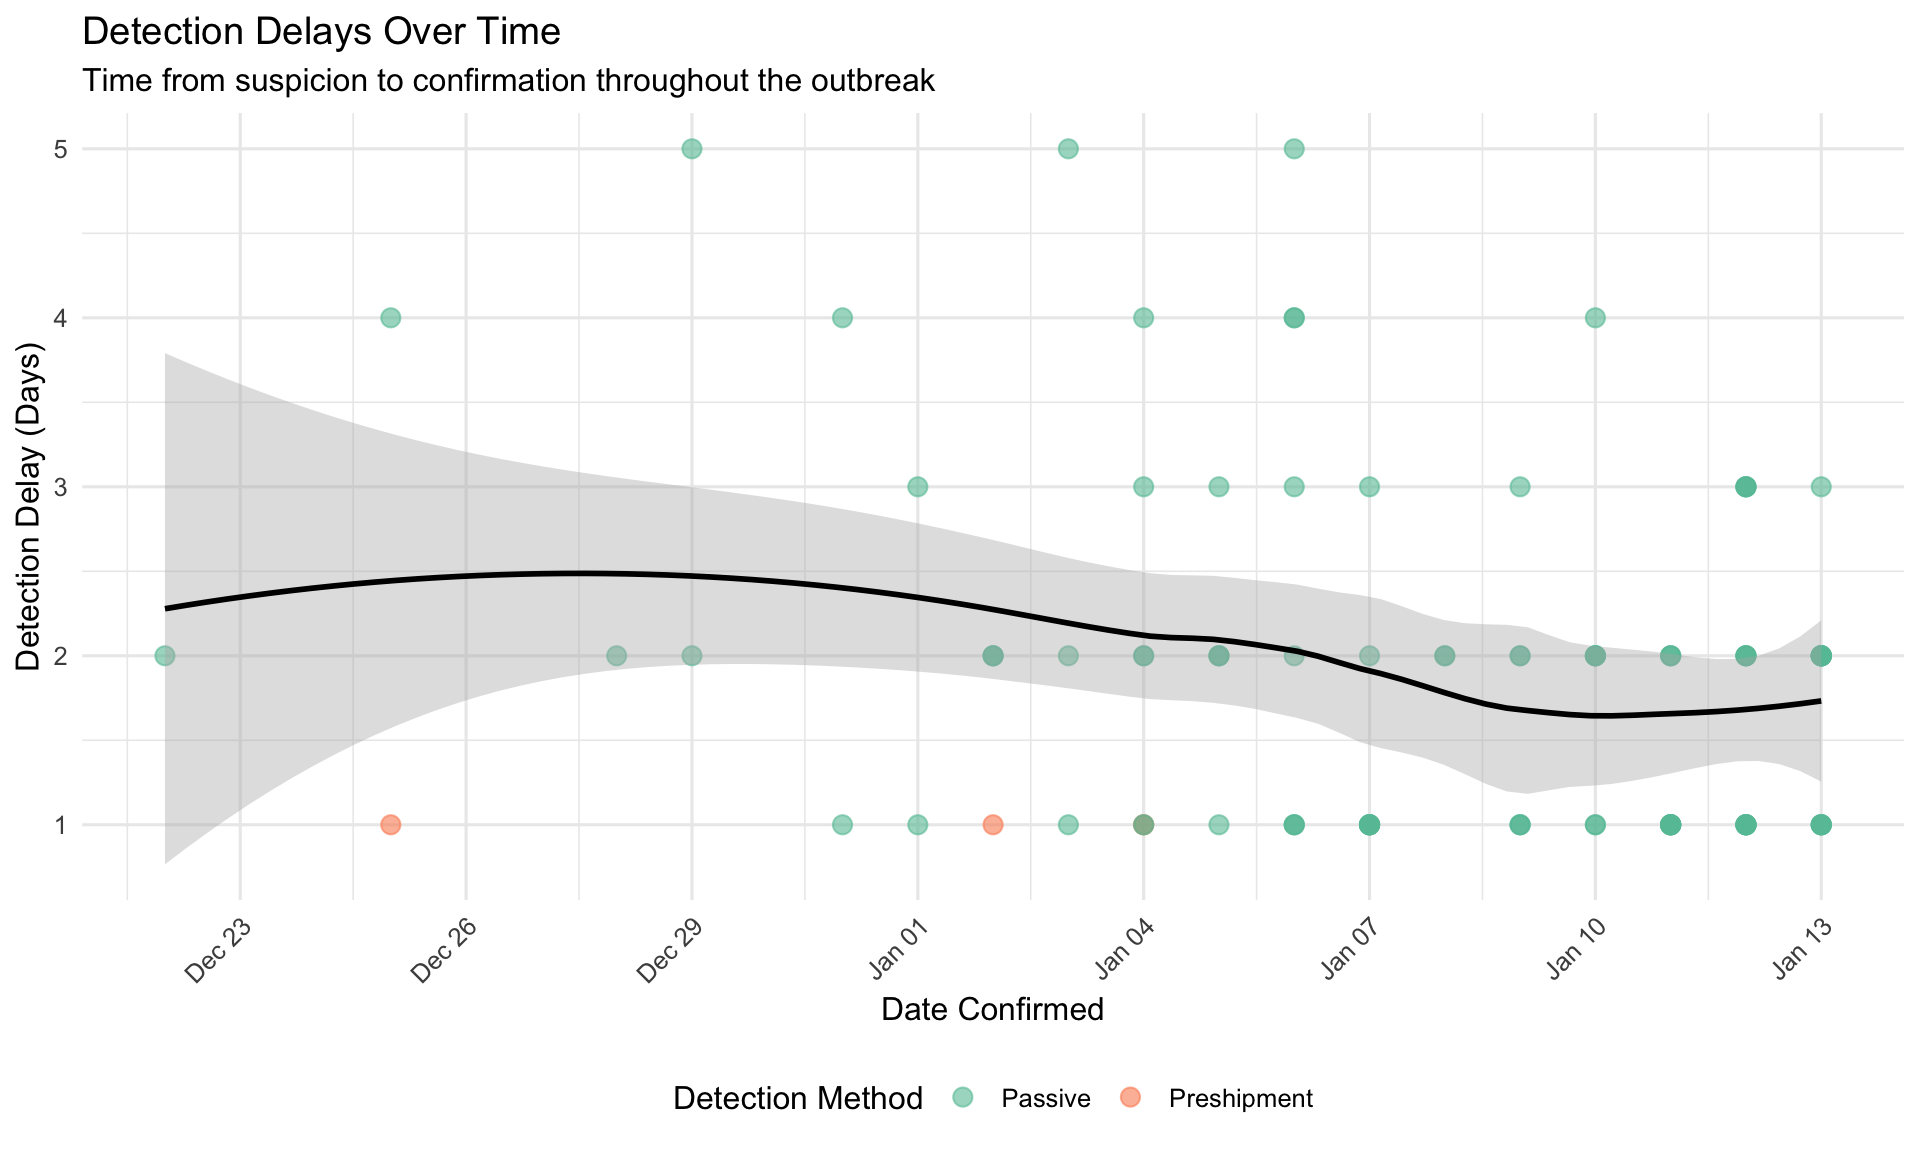
Detection Delay Over Time
The temporal trend analysis reveals whether detection efficiency changed as the outbreak progressed. The smoothed trend line indicates that detection delays remained consistently short, suggesting laboratory capacity kept pace with case load.
Detection Delay by Method
Comparison across detection methods shows:
- Passive surveillance (96 cases): Mean delay 1.9 days - reflects clinical detection and farmer reporting
- Preshipment testing (3 cases): Mean delay 1.0 days - may detect subclinical infections
- Contact tracing (0 cases): No cases with delay data or suspicion dates - proactive surveillance
Detection delays appear similar across methods, indicating consistent laboratory processing regardless of detection pathway.
Summary
This temporal analysis of the HPAI outbreak reveals:
Epidemic Pattern: 103 cases detected over 22 days showing rapid exponential growth
Detection Efficiency: Median confirmation delay of 2.0 days demonstrates efficient laboratory systems
Surveillance Performance: Detection primarily through passive surveillance, with consistent delays across methods
Next steps: Spatial analysis to identify outbreak clusters and risk factor analysis to determine farm characteristics associated with infection risk.