The effectiveness of population-wide, rapid antigen test based screening in reducing SARS-CoV-2 infection prevalence in Slovakia
Background: With the development of rapid antigen tests, population screening for SARS-CoV-2 infection has become logistically feasible and could reduce transmission with limited burden on the uninfected. We report the effects of mass testing on the prevalence of SARS-CoV-2 in Slovakia, the first country to implement such an approach.
Methods: Mass testing was conducted in three rounds: a pilot in four counties, a first national round, and a second round in 45 counties with remaining high infection prevalence. Restrictions on movement and contacts were put in place in the preceding week. We estimated the crude change in the prevalence of infectious infections between tests (cPR). Quasi Poisson regression was used to adjust for covariates (aPR) and mathematical models to adjust for trends preceding mass testing (saPR), and to disentangle the impact of lockdown from that of mass testing.
Results: A total of 5,276,832 tests were conducted of which 50,466 were positive. Between rounds 1 and 2 infection prevalence decreased by 58% (57-58%) in the crude analysis; aPR: 0.39 (0.30-0.50) and saPR: 0.30 (0.26-0.33). In the two weeks between the pilot and round 2 infection prevalence decreased by 82%(81%-83%). In the microsimulation model this was best explained by a combination of the effects of restrictions and highly effective mass testing combined with quarantine of household contacts of test positives.
Conclusions: Mass testing combined with other control measures was highly successful in rapidly reducing SARS-CoV-2 infection prevalence in Slovakia.
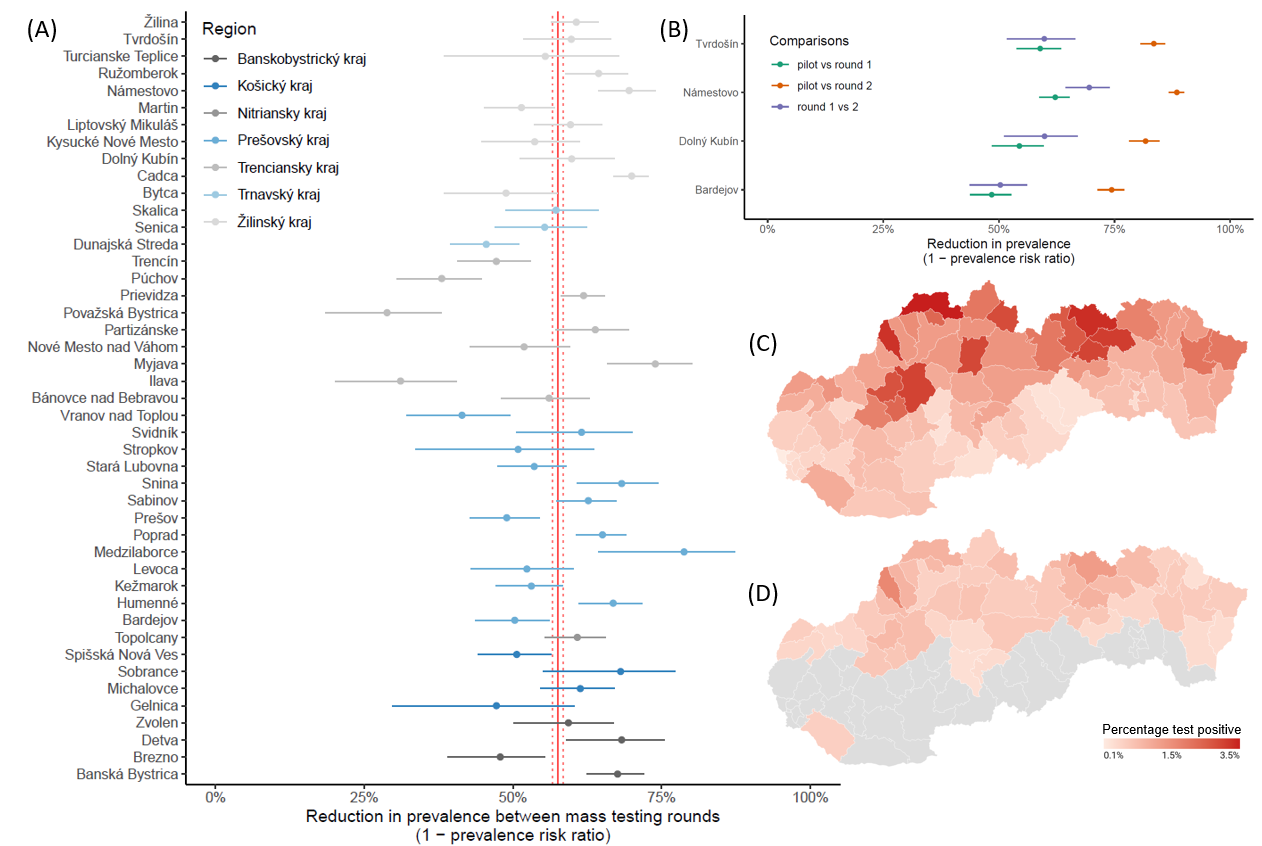
Figure: The change in test positivity between mass testing campaigns. Panel A: change in test positivity (1 - cPR) observed from mass testing round 1 to round 2 in the 45 counties that were eligible for both rounds of mass testing. Counties are grouped and color coded into regions. The crude pooled estimate and its 95% confidence bounds are shown as red vertical lines. Panel B: change in test positivity (1 - cPR) observed from the pilot mass testing round to either the first (green) or the second (orange) national round and from the first to the second mass testing round (blue) in the 4 counties that were included in the pilot. Panel C and D: county level test positivity in the first (C) and second (D) round of mass testing. Grey areas indicate counties that were not part of the second round because their test positivity rate was less than 7 per 1000 and hence have no estimates.