The contribution of asymptomatic SARS-CoV-2 infections to transmission - a model-based analysis of the Diamond Princess outbreak
This work is now published in Elife and can be found here and the code used can be found here
Background: Some key gaps in the understanding of SARS-CoV-2 infection remain. One of them is the contribution to transmission from individuals experiencing asymptomatic infections. We aimed to characterise the proportion and infectiousness of asymptomatic infections using data from the outbreak on the Diamond Princess cruise ship.
Methods: We used a transmission model of COVID-19 with asymptomatic and presymptomatic states calibrated to outbreak data from the Diamond Princess, to quantify the contribution of asymptomatic infections to transmission. Data available included the date of symptom onset for symptomatic disease for passengers and crew, the number of symptom agnostic tests done each day, and date of positive test for asymptomatic and presymptomatic individuals.
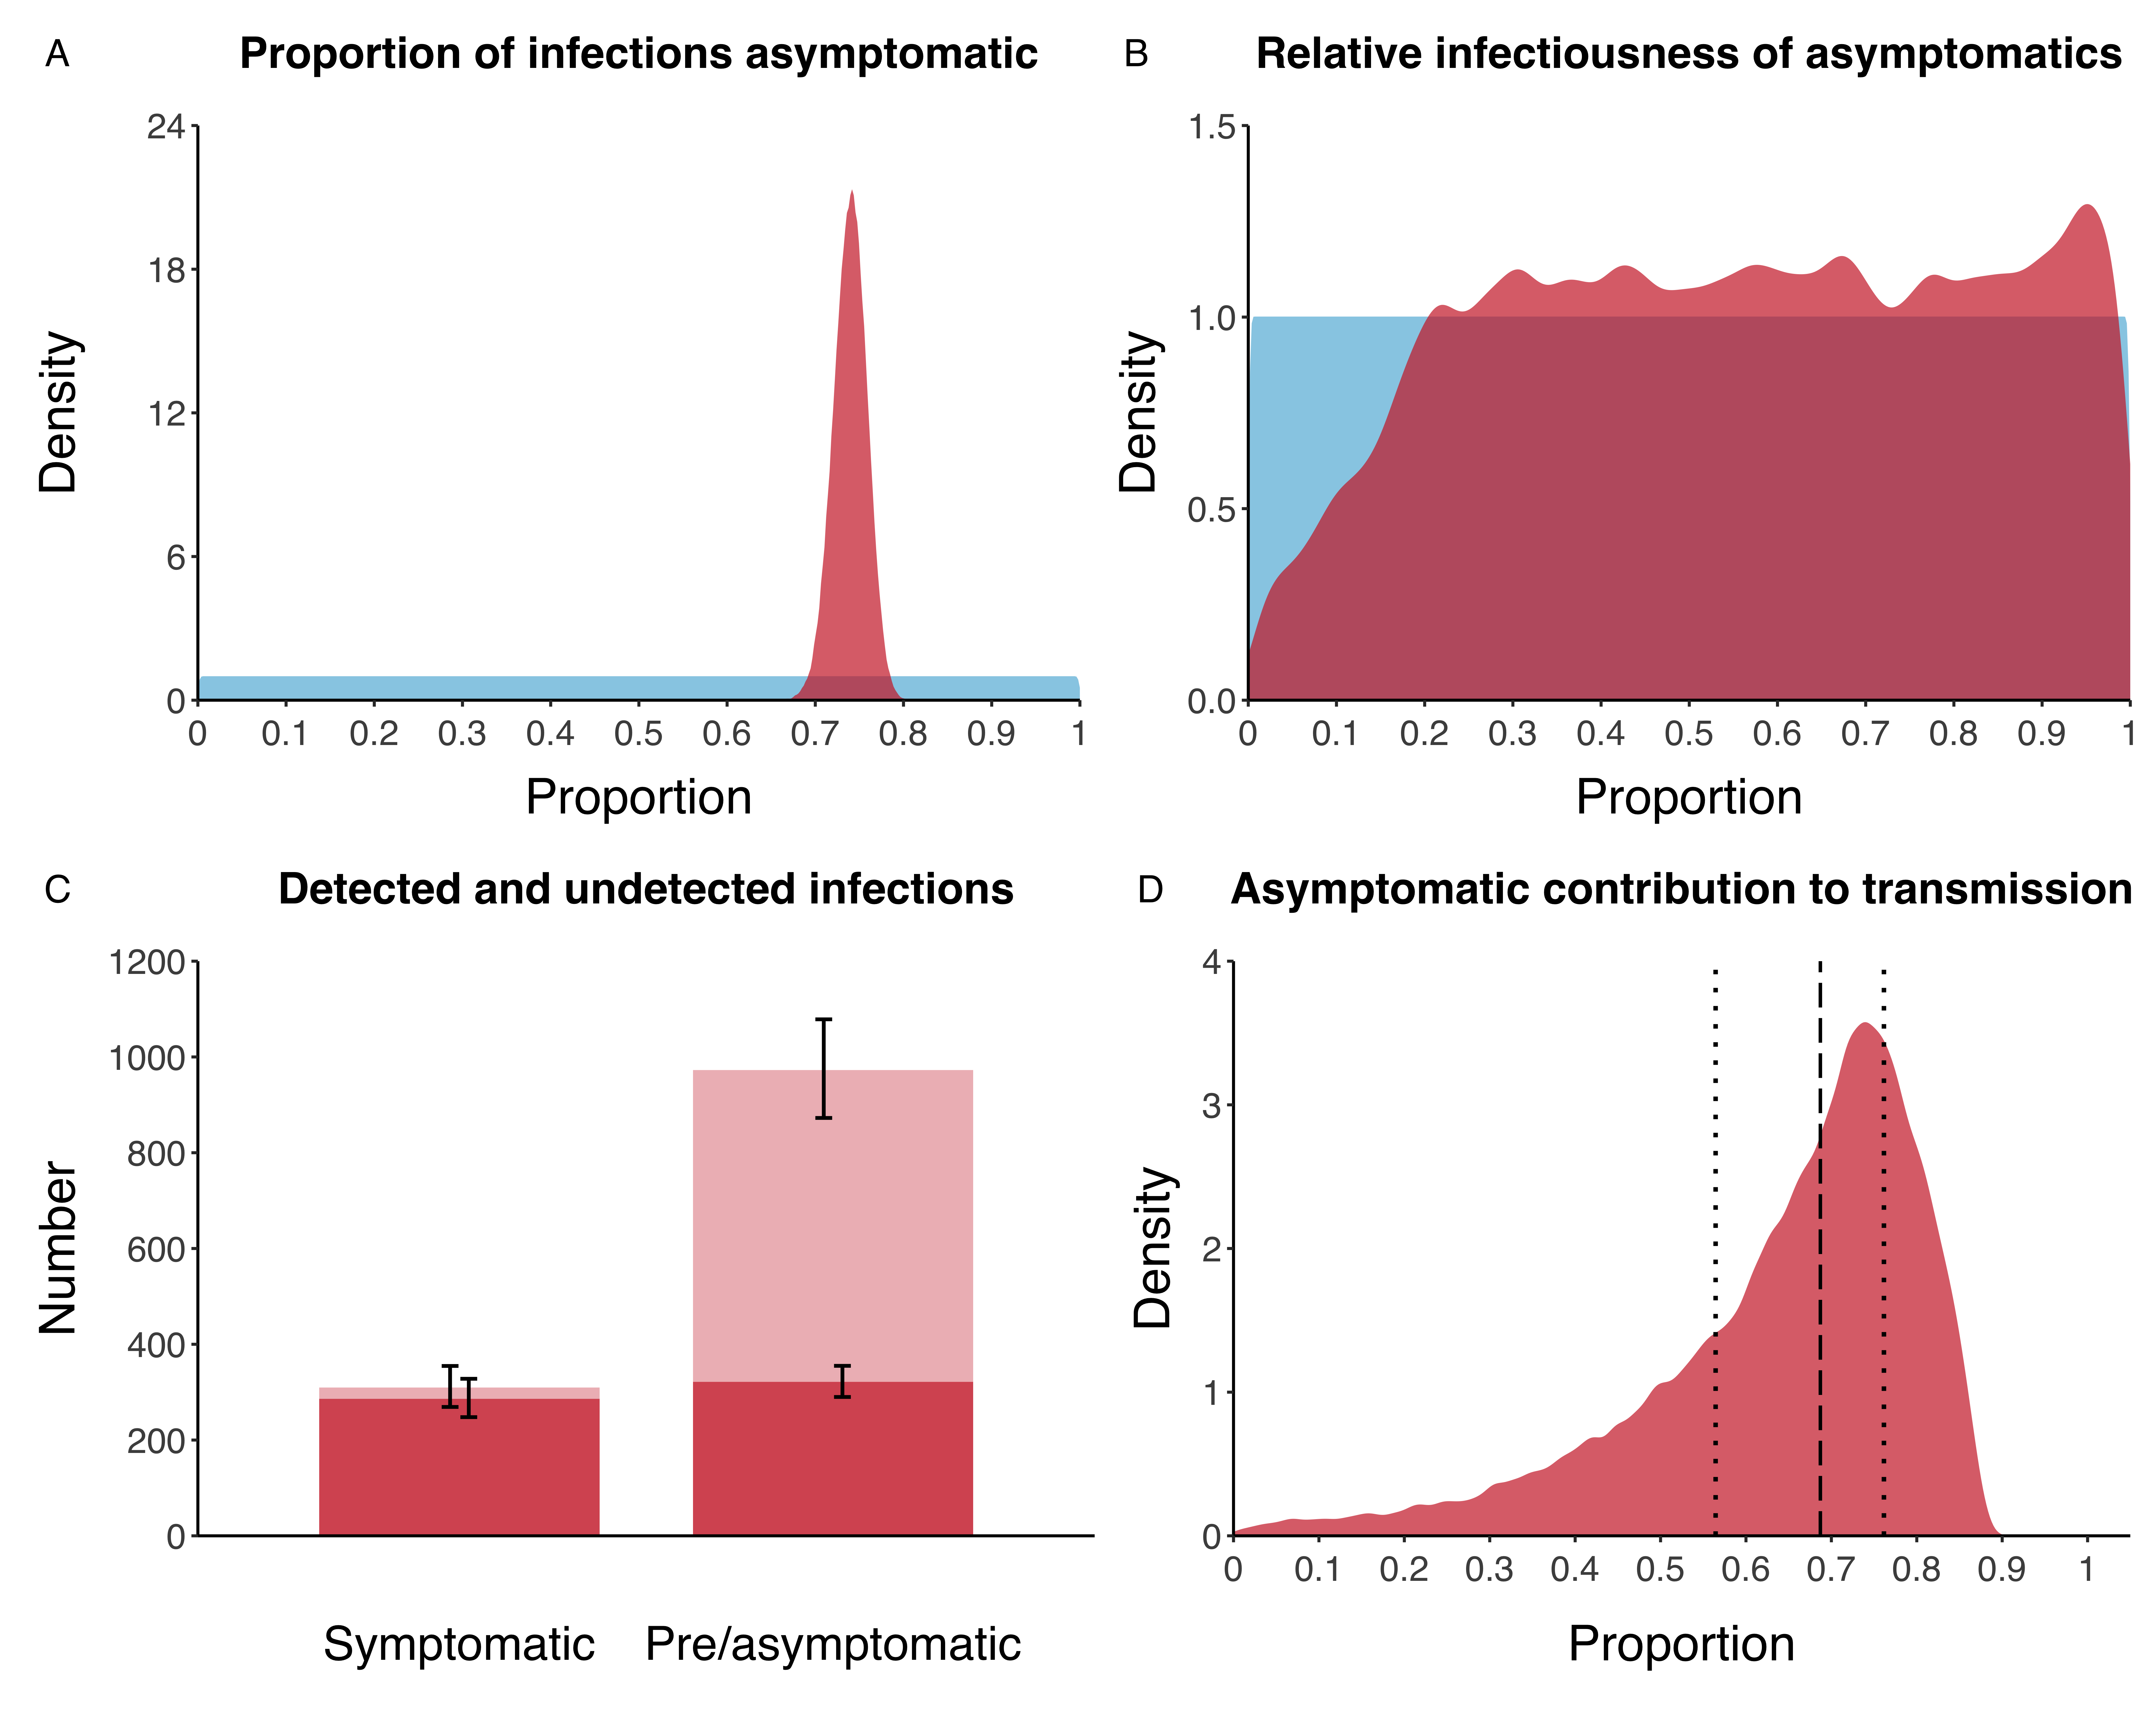
Findings: On the Diamond Princess 74% (70-78%) of infections proceeded asymptomatically, i.e. a 1:3.8 case-to-infection ratio. Despite the intense testing 53%, (51-56%) of infections remained undetected, most of them asymptomatic. Asymptomatic individuals were the source for 69% (20-85%) of all infections. While the data did not allow identification of the infectiousness of asymptomatic infections, assuming no or low infectiousness resulted in posterior estimates for the net reproduction number of an individual progressing through presymptomatic and symptomatic stages in excess of 15.
Interpretation: Asymptomatic SARS-CoV-2 infections may contribute substantially to transmission. This is essential to consider for countries when assessing the potential effectiveness of ongoing control measures to contain COVID-19.
 Figure: A) Prior (blue) and posterior (red) probability distribution for the proportion progressing to asymptomatic infections. B) Prior (blue) and posterior (red) probability distribution for the relative infectiousness of asymptomatic infections. C) number of asymptomatic infections and symptomatic cases detected (dark red) and not detected (light red) in the outbreak. Error bars indicate 95% posterior intervals). D) Posterior probability distribution for proportion of transmission that is from asymptomatic individuals. Dotted lines show median and interquartile range.