Dynamics of B.1.617.2 in the UK from importations, traveller-linked and non-traveller-linked transmission
This study has not yet been peer reviewed.
Read the 24th May report here. Accompanying code is available here.
Earlier versions of this analysis: 12th May report; 18th May report.
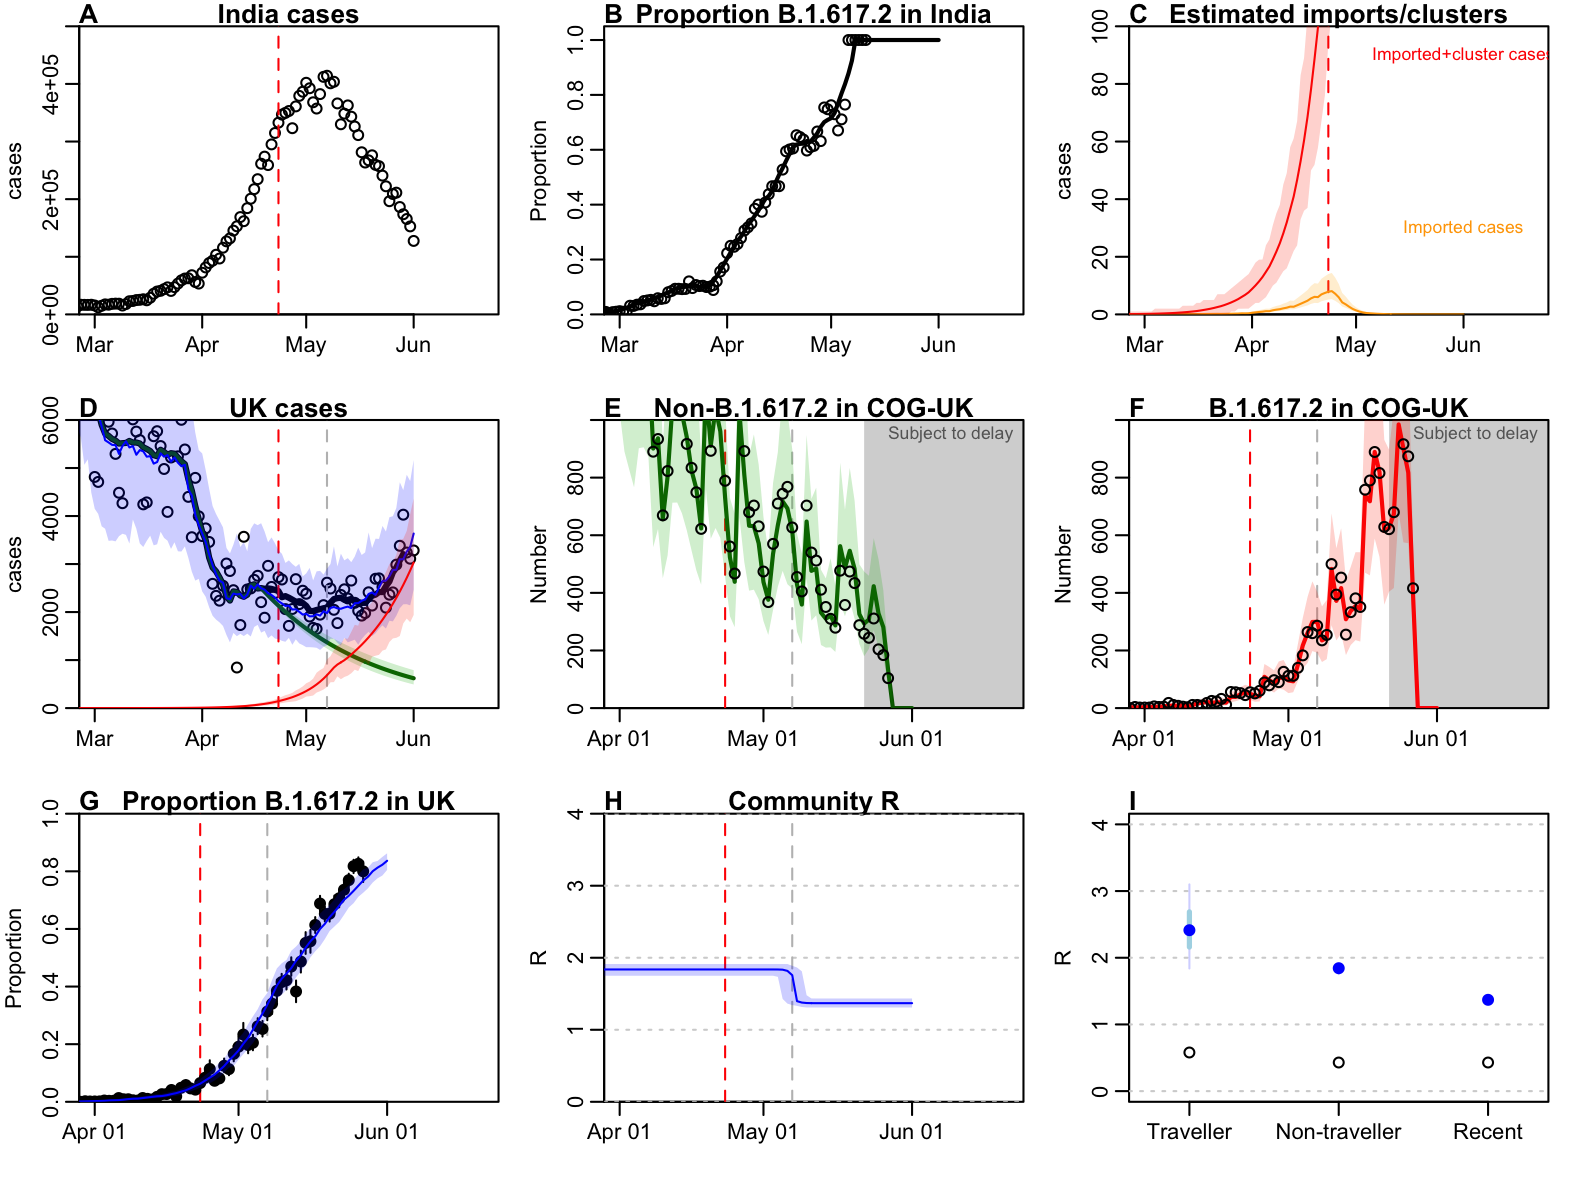
Plot below shows results for 4th June 2021. These results would suggest 44% (95% CrI: 37–51%) higher transmission for B.1.617.2 compared to non-B.1.617.2 variants circulating.

Figure 1: A) Reported cases in India. B) Proportion of reported sequences in India that are B.1.617.2, with black line showing moving average (constrained to end at 100%). C) Estimated imported cases of B.1.617.2 into the UK that contribute to onwards transmission (orange line, with 95% shaded CrI interval), reported traveller cases of B.1.617.2 as described in PHE Technical Report 12 (black dots); simulated imported cases and onwards transmission using maximum a posteriori (MAP) model estimate (red line with 95% negative binomial CrI). D) Reported cases in the UK. Black dots show data, black line shows 7 day centred moving average; green line shows estimated non-B.1.617.2 cases with 95% CrI; red line as in (C); blue line and shaded region shows predicted total cases in UK with negative binomial 95% CrI. E) Black dots show number of non-B.1.617.2 sequences in COG-UK data up to 11th May 2021; green line shows fitted model with 95% negative binomial CrI. Grey region shows data in the past week, which is likely subject to reporting delays. F) Black dots show number of B.1.617.2 sequences in COG-UK data up to 11th May 2021; red line shows fitted model with 95% negative binomial CrI. G) Black dots show proportion of B.1.617.2 sequences in COG-UK data up to 11th May 2021; blue line shows MAP model estimate. H) Estimated change in R among non-travellers over time, assuming a step-change at some point during the observed period. Line shows median and shaded region 95% CrI; as in other panels, dashed grey line shows date B.1.617.2 was declared VOC in UK. I) Estimate of Rtraveller , Rnon-traveller and Rrecent in model, with thick line showing 50% CrI and thin line showing 95% CrI. Dots show implied R based on contact tracing data in PHE Technical Report 12.