Analysis of temporal trends in potential COVID-19 cases reported through NHS Pathways England
This study has not yet been peer reviewed.
This is a summary of the latest trends seen in potential COVID-19 cases reported through NHS Pathways. The results presented here include data up to 2020-05-28. For a full discussion of this analysis, please refer to our paper available here
Introduction
NHS Pathways is a triage system for public calls and online reports for medical care [1]. This system is currently being used throughout England to assist individuals reporting potential COVID-19 symptoms. Since the 18th of March 2020, data on daily phone calls and completed online assessments which have received a potential COVID-19 final disposition are openly available. These assessments are either completed via calls to 111 and 999 (which are respectively for non-urgent, and urgent medical problems), or through 111-online self-completed reports. The fraction of assessments corresponding to actual COVID-19 cases is unknown, but in the absence of wide-scale testing, the NHS Pathways dataset may be one of the best available proxies for COVID-19 incidence in the community. While prone to self-reporting biases, it is likely to better reflect milder cases and be less biased by different severity profiles than hospital admission data, which by definition reflect the most acute cases.
Here, we analyse NHS Pathways data until 2020-05-28 to assess the temporal dynamics of COVID-19 in England. Specifically, we investigated potential changes in the growth rate of the epidemic over time, and compared the observed patterns across NHS regions. We derived time-varying estimates of the growth rates, halving time and effective reproduction numbers for the different regions. We also assessed the potential correlation between NHS Pathways with COVID-19 daily deaths in England, to gain an initial understanding of its possible value within an early detection system.
Latest results
The results below were generated with data up to 2020-05-28.
Numbers of daily NHS Pathways report and NHS COVID-19 deaths
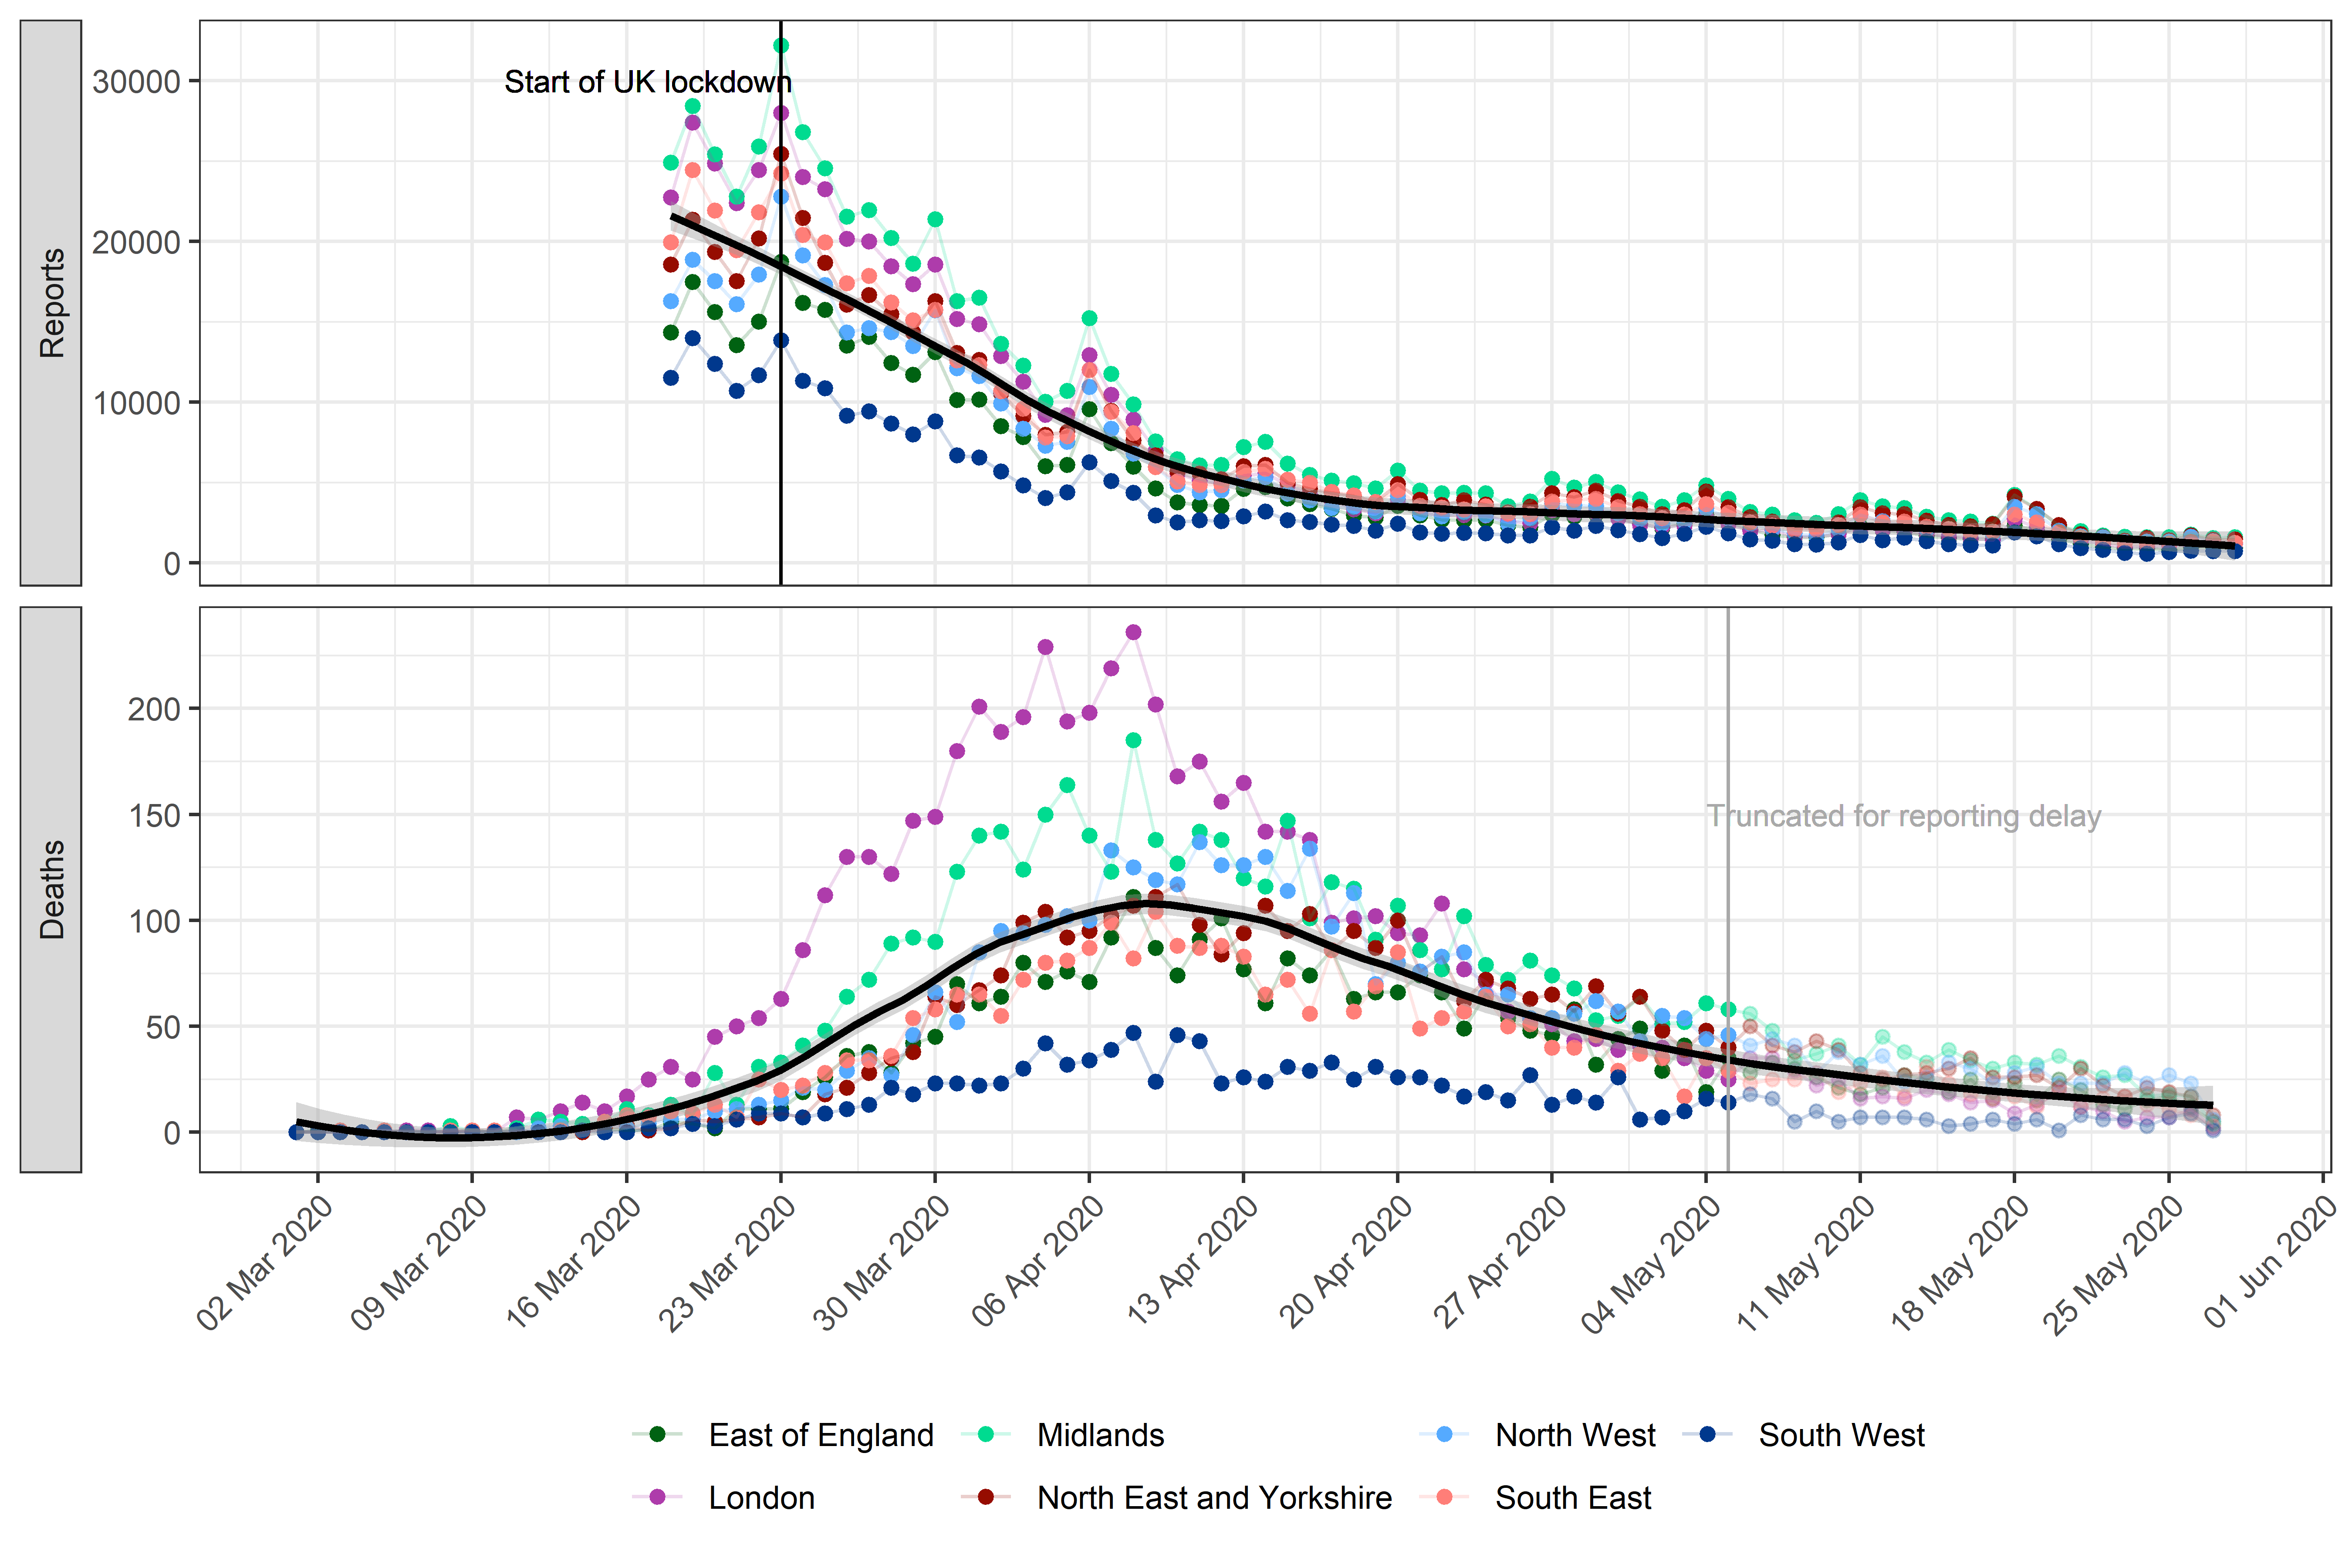 Figure 1. Daily potential COVID-19 cases reported through NHS
Pathways and reported COVID-19-related deaths, by NHS region.
Pathways data include calls to 111 and 999, as well as 111-online
reports. Dates correspond to the date of case report and death report,
respectively, with x-axis labels corresponding to Mondays. The solid
black line and grey ribbon correspond to a lowess smoother and its 95%
confidence interval. The start of the lockdown in England (2020-03-23)
and date at which death data were truncated to avoid bias from reporting
delay (2020-05-07) are highlighted by vertical lines.
Figure 1. Daily potential COVID-19 cases reported through NHS
Pathways and reported COVID-19-related deaths, by NHS region.
Pathways data include calls to 111 and 999, as well as 111-online
reports. Dates correspond to the date of case report and death report,
respectively, with x-axis labels corresponding to Mondays. The solid
black line and grey ribbon correspond to a lowess smoother and its 95%
confidence interval. The start of the lockdown in England (2020-03-23)
and date at which death data were truncated to avoid bias from reporting
delay (2020-05-07) are highlighted by vertical lines.
Estimates of growth rate and effective reproduction number
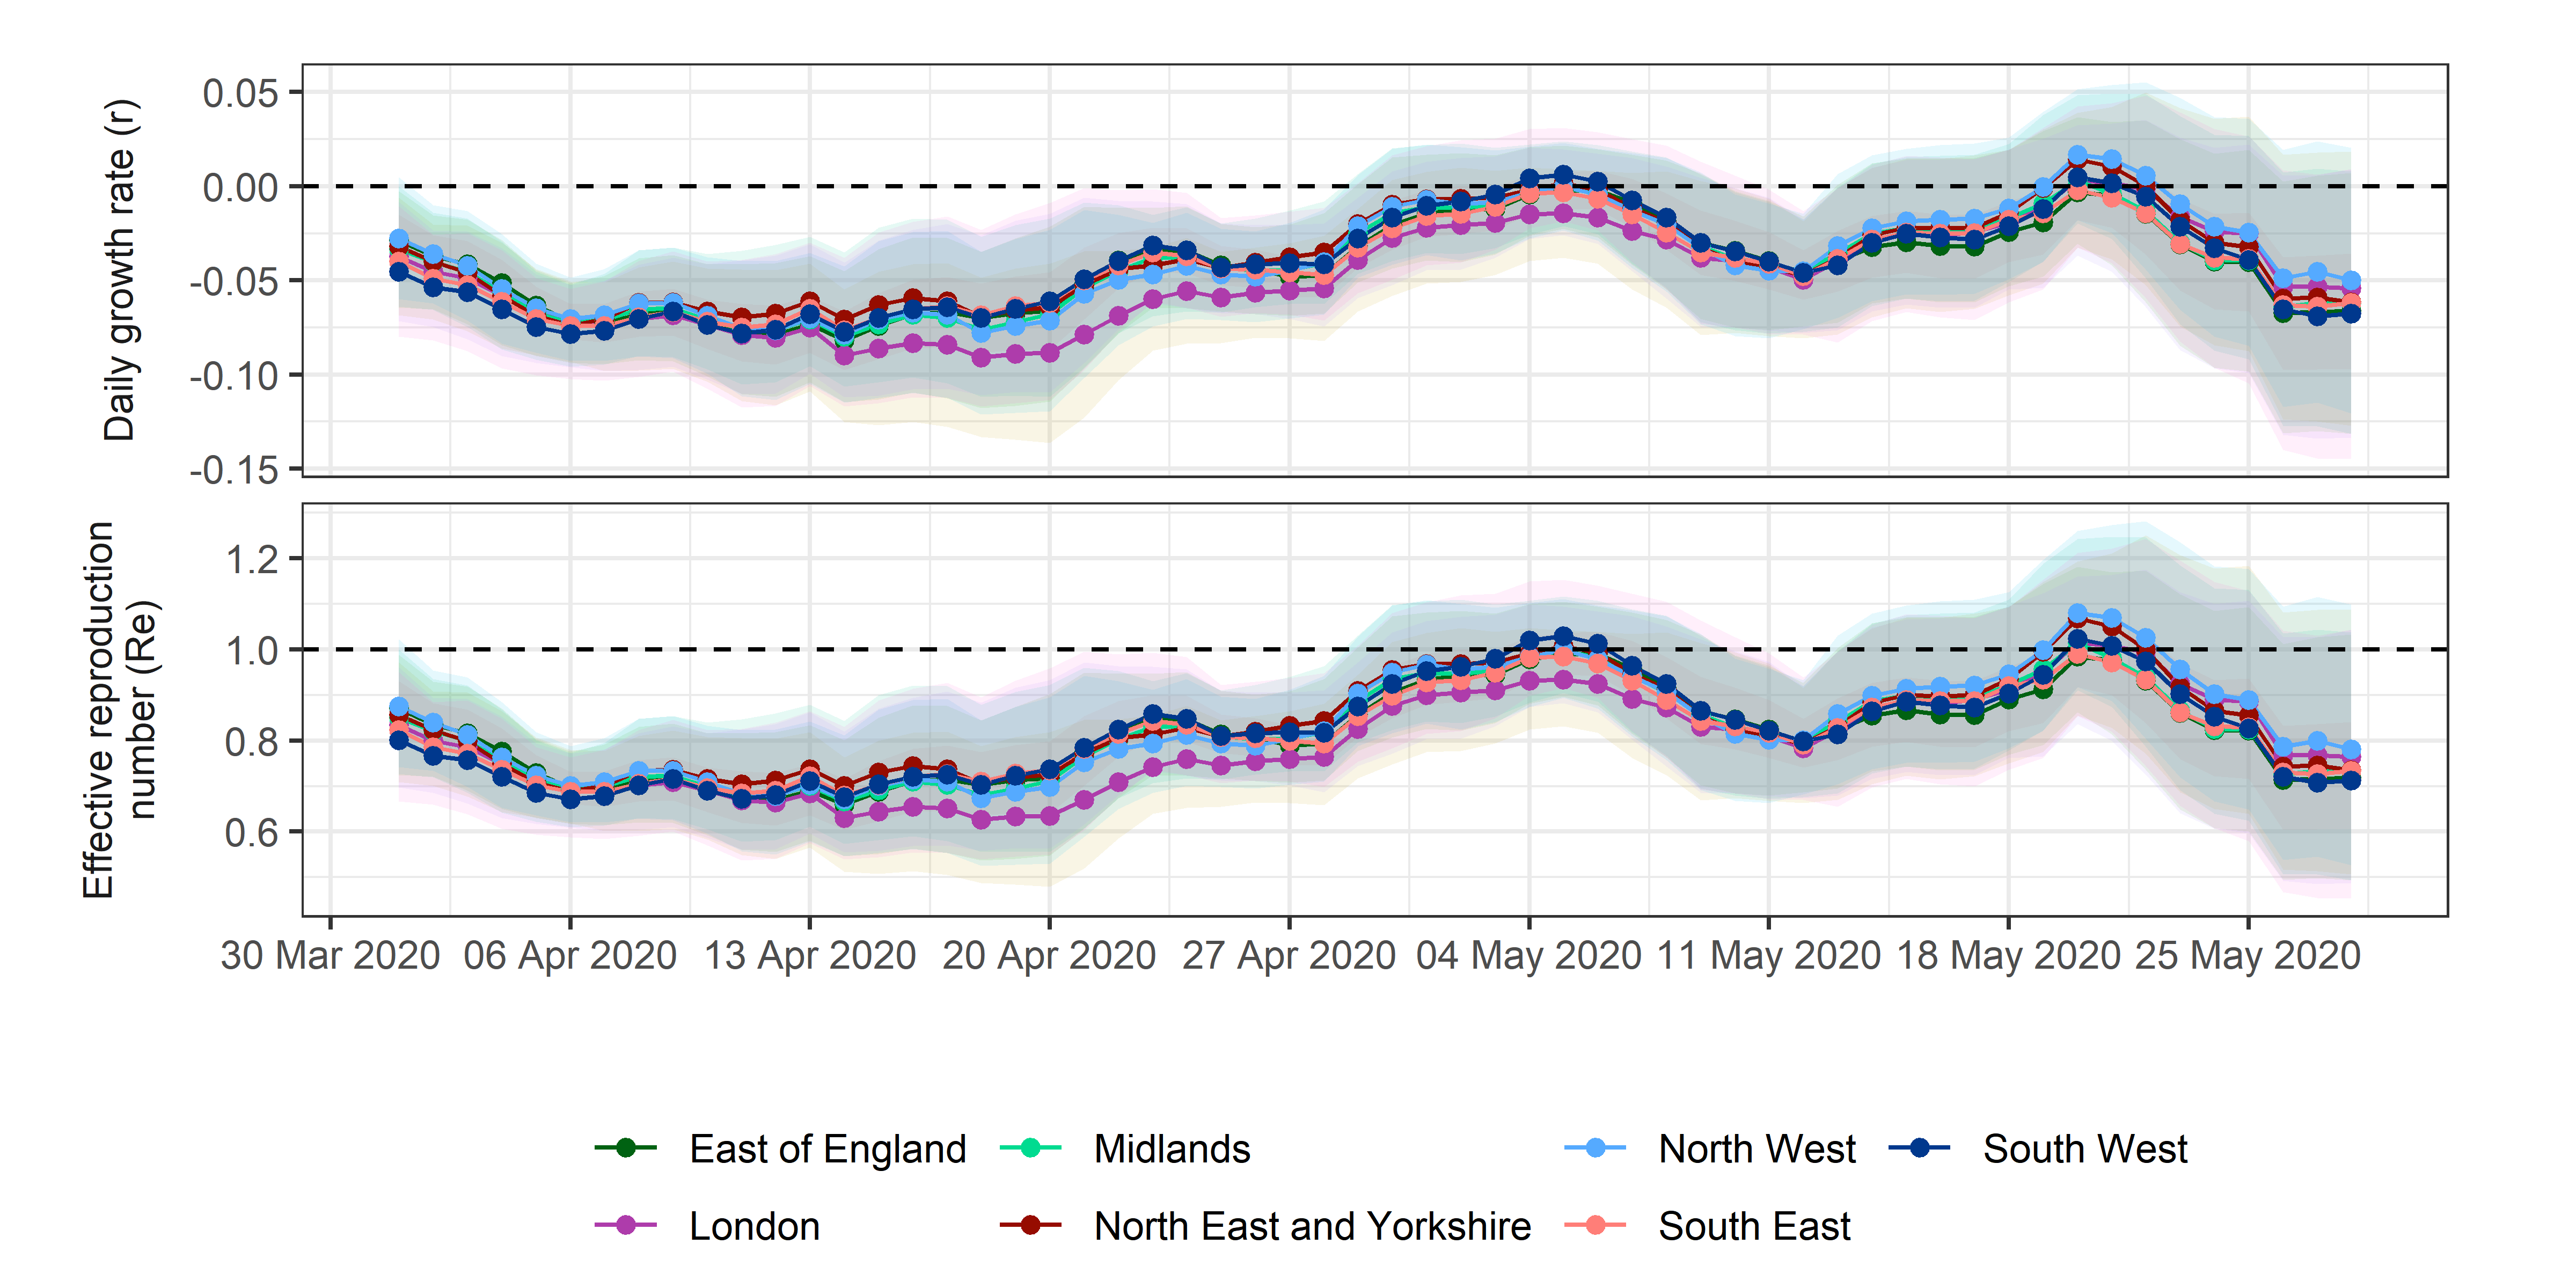 Figure 2. Estimates of daily growth rates (r) and effective
reproduction numbers (Re) for potential COVID-19 cases
reported through NHS Pathways. Dotted lines indicate the central
estimate, and ribbons their 95% confidence intervals. Estimates are
indicated at the end of the time window used for estimation, so that
values of r and Re provided on a given day correspond to the
2 weeks leading up to that day.
Figure 2. Estimates of daily growth rates (r) and effective
reproduction numbers (Re) for potential COVID-19 cases
reported through NHS Pathways. Dotted lines indicate the central
estimate, and ribbons their 95% confidence intervals. Estimates are
indicated at the end of the time window used for estimation, so that
values of r and Re provided on a given day correspond to the
2 weeks leading up to that day.
The lowest r estimated across all NHS regions and for all available dates was on 2020-04-18 for the London region at -0.091 (95% CI: -0.133 ; -0.049), corresponding to a halving time of 7.629 days (95% CI: 5.199 ; 14.285) and an Re of 0.627 (95% CI: 0.488 ; 0.788).
The most recent estimate of r averaged over all NHS regions is -0.061 (95% CI: -0.127 ; 0.005), corresponding to an Re of 0.74 (95% CI: 0.51 ; 1.027).
Correlation between NHS Pathways reports and deaths
Figure 3 illustrates the observed trend in correlation across all tested lags. The strongest correlation between NHS Pathways reports and deaths was obtained with a lag of 16 days (Pearson’s correlation = 0.97; 95% CI: 0.93 ; 0.98).
Estimates become increasingly unstable for longer lags as the number of points within the overlapping time window becomes small.
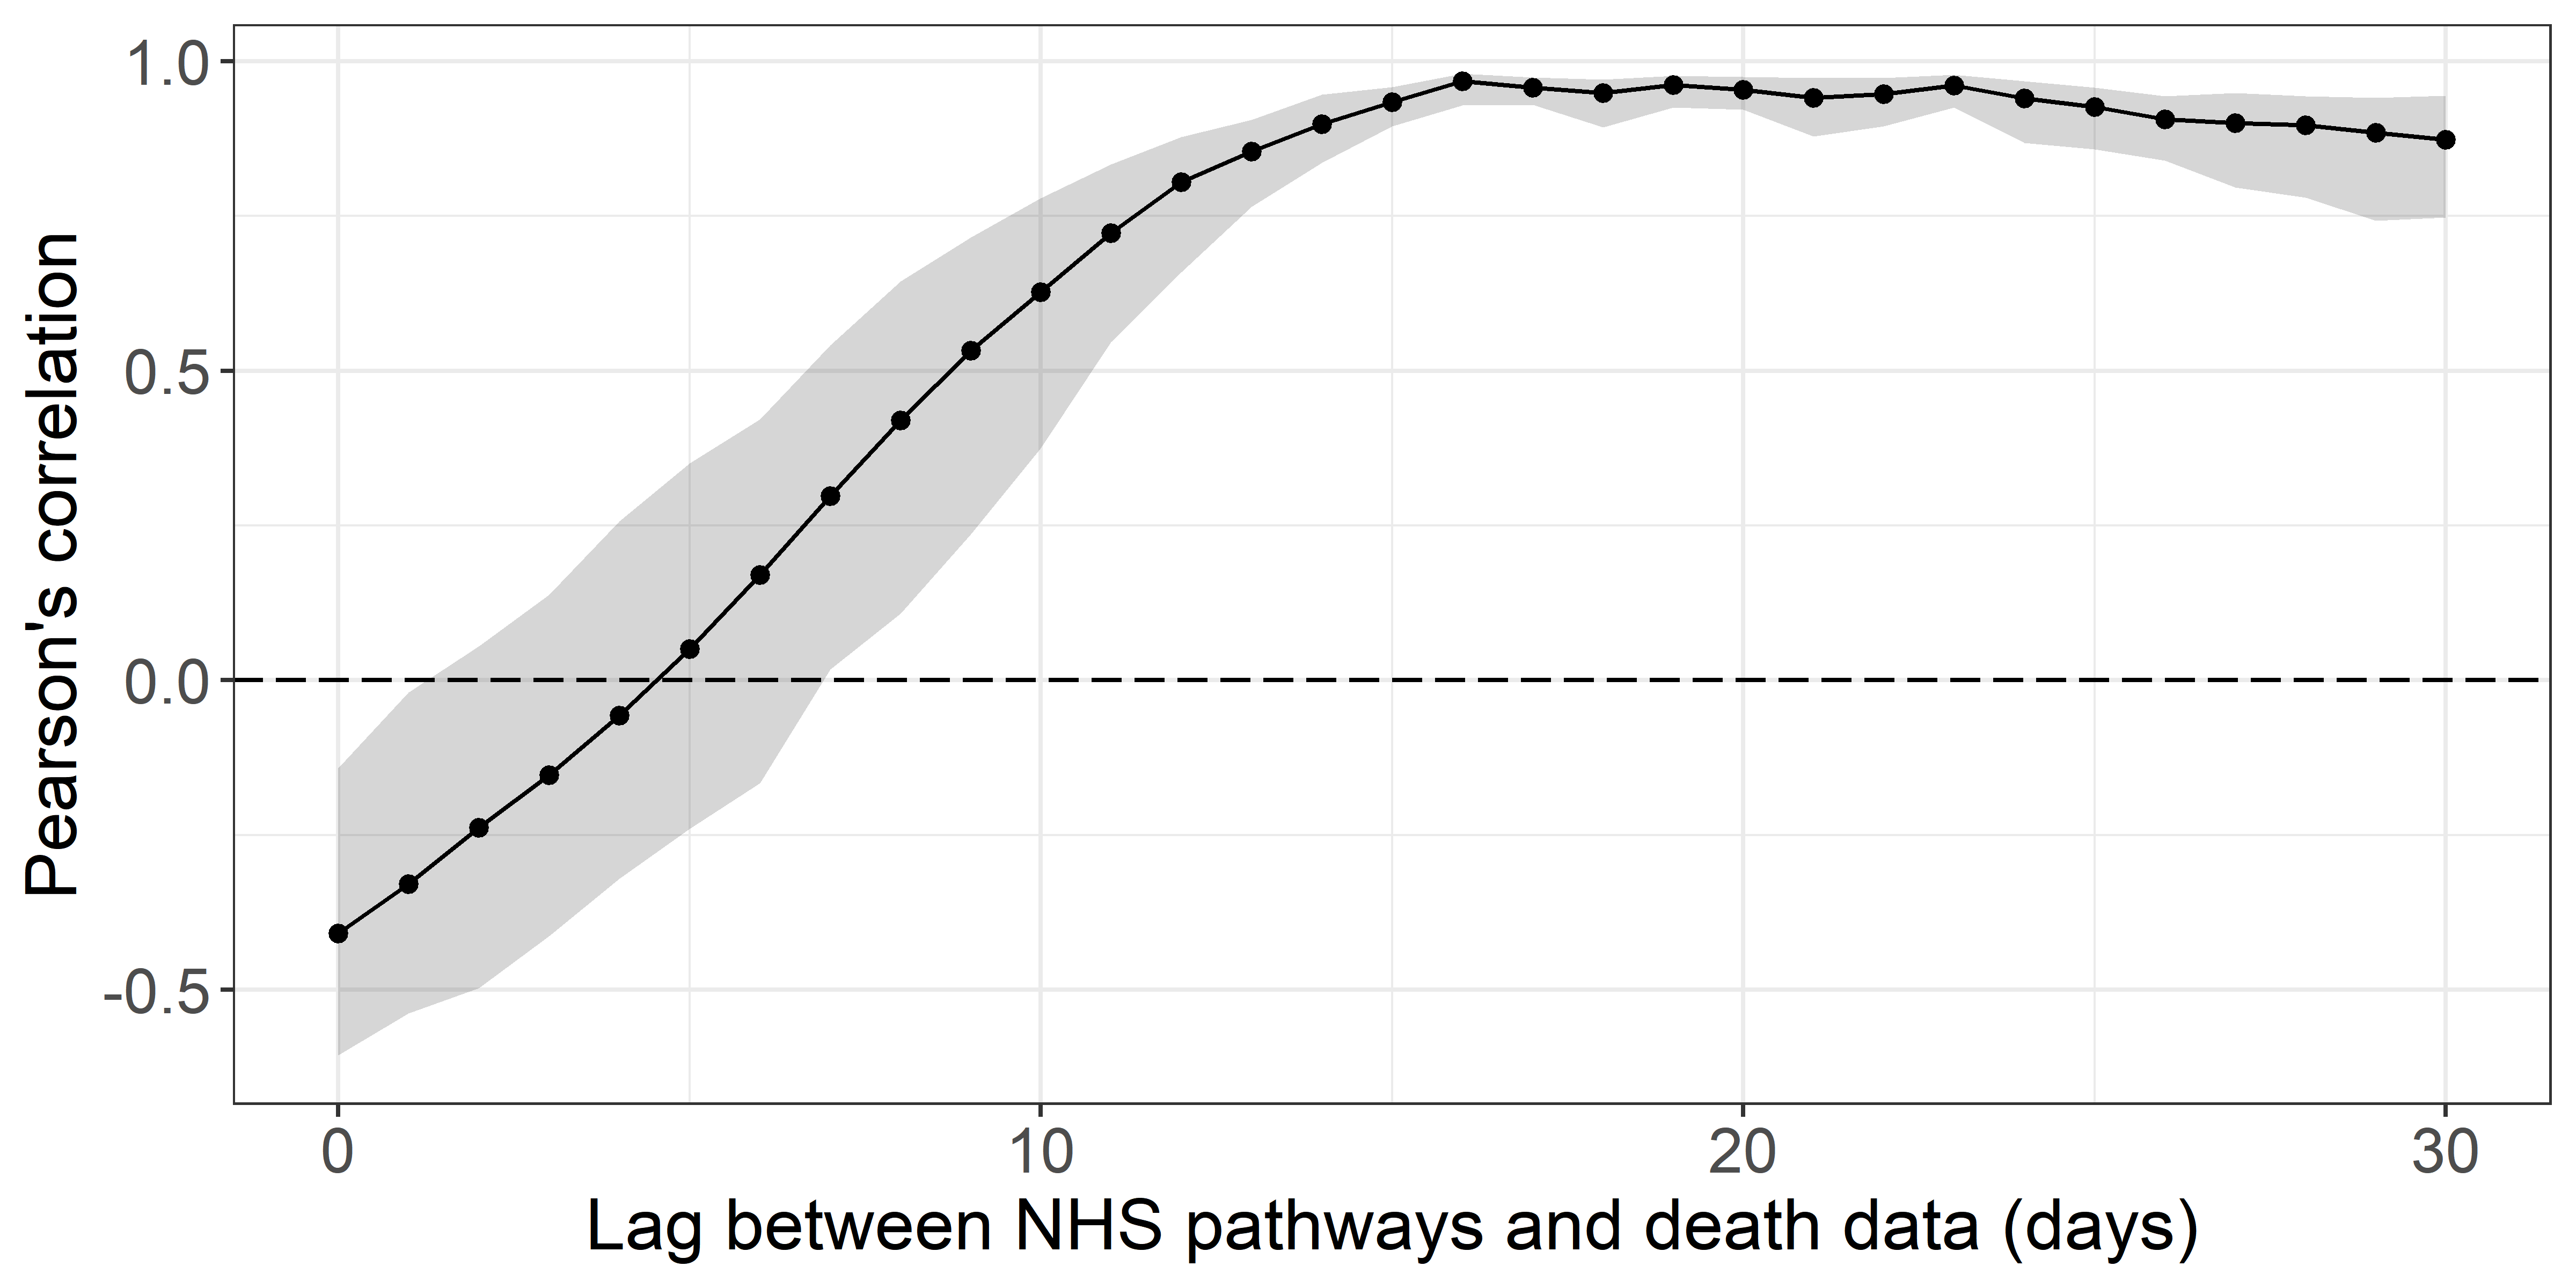 Figure 3. Pearson’s correlation between deaths and potential COVID-19
cases reported through NHS Pathways, lagged between 0 and 30 days.
95% confidence intervals are calculated by bootstrapping with 1,000
replicates.
Figure 3. Pearson’s correlation between deaths and potential COVID-19
cases reported through NHS Pathways, lagged between 0 and 30 days.
95% confidence intervals are calculated by bootstrapping with 1,000
replicates.
Fitting a quasi-Poisson GLM, we found that over 87.5% of the deviance in daily reported deaths could potentially be explained by NHS Pathways reports 16 days prior, with an average of 2.14 (bootstrap 95% CI: 1.67 ; 2.7) additional deaths for every 1,000 potential COVID-19 cases reported in NHS Pathways 16 days before (intercept = 268, 95% CI: 240 ; 298; % increase per 1000 notifications = 0.01, 95% CI: 0.7 ; 0.91)) (Figure 4).
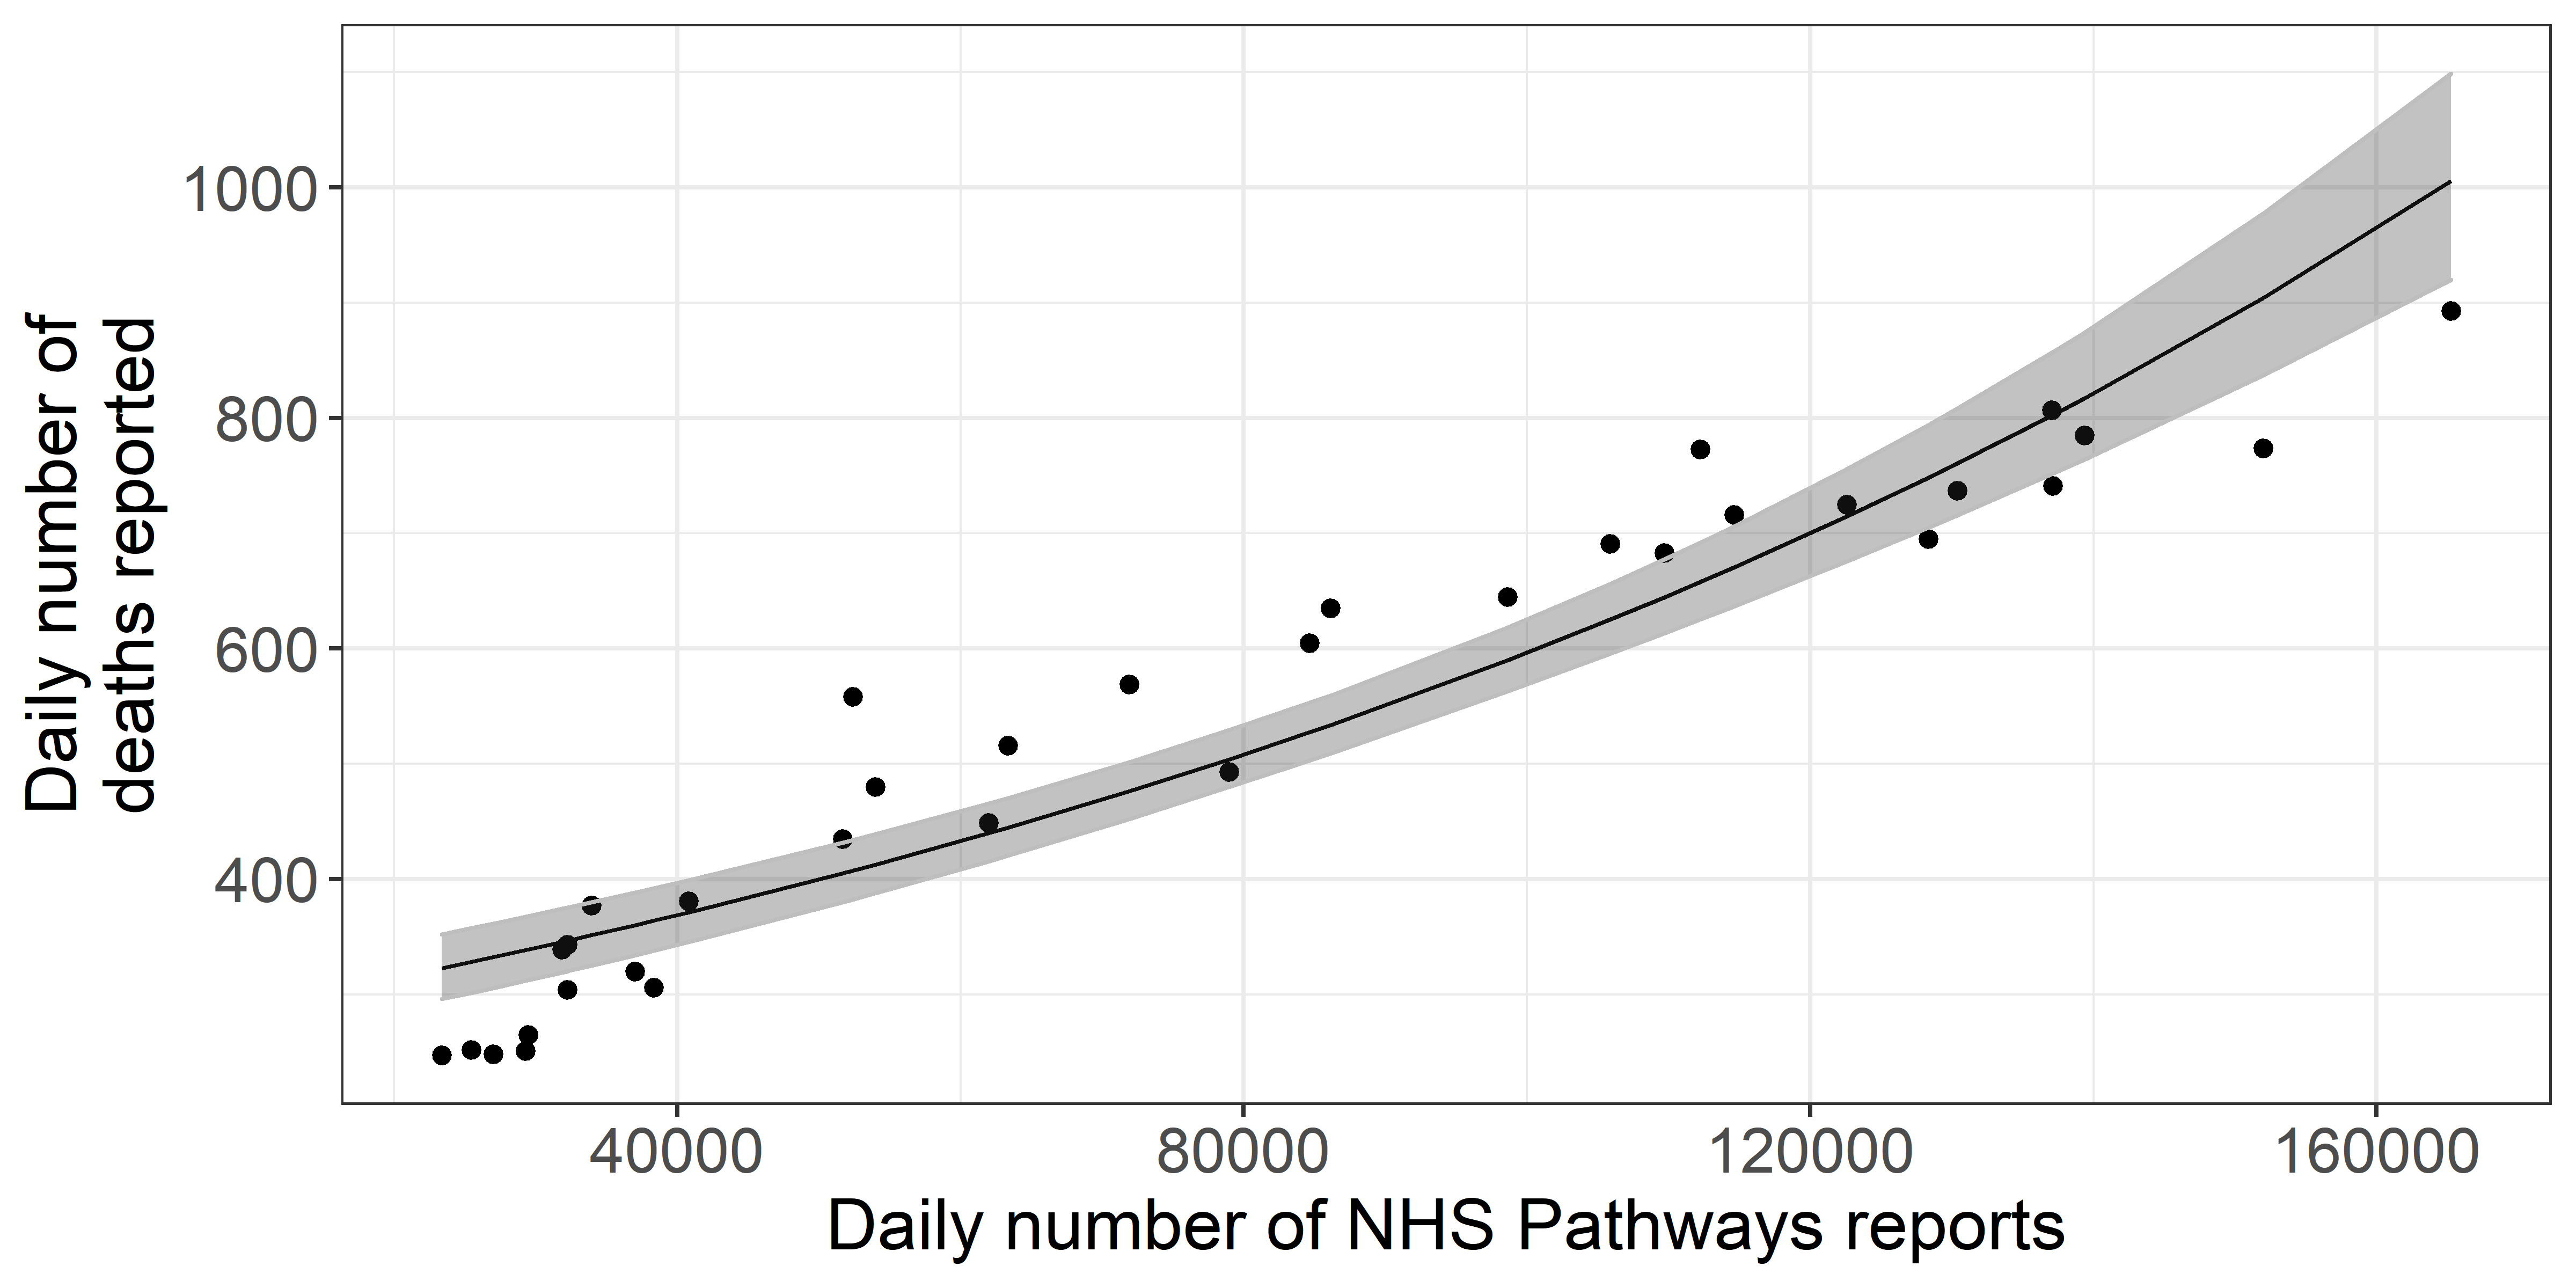 Figure 4. Daily total COVID-19 deaths reported in England, against
the number of potential COVID-19 cases reported through NHS Pathways
with a lag of 16 days. The black line and grey ribbon correspond to
predictions from the regression model and associated 95% confidence
intervals.
Figure 4. Daily total COVID-19 deaths reported in England, against
the number of potential COVID-19 cases reported through NHS Pathways
with a lag of 16 days. The black line and grey ribbon correspond to
predictions from the regression model and associated 95% confidence
intervals.
Methods
Data extraction
We extracted the NHS Pathways data up to 2020-05-28 through the NHS Digital website [1], where they are updated daily, every weekday. The number of reports are stratified by Clinical Commissioning Group (CCG), gender and age group (0-18, 19-69 and 70-120 years old) of the patients. We mapped the CCGs to their corresponding NHS regions using publicly available CCG data [2], and used this geographic resolution for our analysis. All dates indicated refer to the date of reporting.
Temporal analysis
Total numbers of reports (including all three data sources: 111 calls, 999 calls, and 111-online reports) were modelled using quasi-Poisson generalised linear models (GLM) with log links, to account for exponential trends as well as over-dispersion of the data [3]. Predictors included time (in days since the first data point (2020-03-18) with interaction terms for varying slopes and intercepts between NHS regions, and day of the week (weekend, monday, or rest of the week) to account for potential differences in reporting over the weekend and at the start of the week. Growth rates (r) for each NHS region and their 95% confidence intervals were directly deduced from the corresponding coefficients. All models were fitted using maximum-likelihood.
To assess potential changes of the growth rate over time, analyses were performed over rolling windows of 14 days from the earliest available date (2020-03-18) to the latest available one (2020-05-28). Growth rates and associated confidence intervals were calculated for each time window. Whenever the upper bound of r was negative, corresponding halving times were calculated as log(0.5)/r. Growth rates were converted to effective reproduction numbers Re using the approach described in Wallinga and Lipsitch [4] and implemented in the epitrix package [5], with a serial interval modelled as a gamma distribution with mean 4.7 days and standard deviation 2.9 days [6].
Correlation with reported deaths
To test the validity of the NHS Pathways dataset as an early detection system, we compared daily total counts of reports (including all three data sources: 111 calls, 999 calls, and 111-online reports) with publicly available NHS data on COVID-19 daily deaths [7]. This dataset includes daily counts of COVID-19 deaths in hospitals in England NHS regions. All dates refer to the date of death. However, the data are subject to bias from reporting delays, with more recent counts excluding a proportion of deaths which have not yet been reported. To account for this, we excluded data from the last 3 weeks from this analysis.
We calculated Pearson’s correlation between the daily time series of deaths and NHS Pathways reports, lagging the reports from zero to thirty days. Approximate 95% confidence intervals for each correlation estimate were calculated by bootstrapping with 1,000 replicates. From this we identified an optimal lag at which the reports correlate most strongly with subsequent deaths. We then further evaluated the potential of NHS Pathways reports lagged at this value as a predictor, assuming a quasi-Poisson distribution for daily deaths.
All analyses were performed using the R software [8], and the code is publicly available from https://github.com/qleclerc/nhs_pathways_report and distributed under the MIT license.
Limitations
A number of caveats may affect our results. Firstly, the data we considered are at best a proxy for the true incidence of COVID-19 in the country as they rely on self-reported symptoms interpreted by an algorithm, and were not confirmed by virological tests. This is further exacerbated by the fact that individuals might access NHS Pathways more than once to report their symptoms, which could artificially increase the numbers of potential COVID-19 cases.
As NHS Pathways is based on self-reporting, several biases could affect the data, such as changes in service availability and delays in the uptake of the 111-online reporting system. When estimating growth rates over time and geographic regions, we implicitly assume that self-reporting behaviours have not substantially changed over time, and have been similar across different NHS regions. In reality, self-reporting could be strongly biased by behavioural issues, such as the effect of news coverage which might lead individuals to pay more attention to their symptoms and report them. Inversely, individuals could reduce their perception of the risk of the disease over time as they become used to hearing about it daily, which would decrease their likelihood of noticing and reporting symptoms. Similarly, differences in self-reporting behaviours across various age groups would likely bias the age composition of the potential COVID-19 cases reported here.
While NHS Pathways data may better capture the epidemic in the community than hospitalisation data, these data do not only reflect community cases. In fact, a fraction of cases reported through 999 are likely to be hospitalised, as well as smaller proportions of cases reported through 111 calls and 111-online. Therefore, the data we considered here most likely reflect the epidemic as a whole, rather than just in the community. We also note that all results presented rely on dates of calls or online reports, so that estimates of transmissibility are likely lagged by a few days compared to the true, underlying epidemic. Unfortunately, the delays from exposure to notification through NHS Pathways cannot be estimated from current publicly available data.
References
1 - Potential Coronavirus (COVID-19) symptoms reported through NHS Pathways and 111 online - NHS Digital [Internet]. [cited 2020 May 5]. Available from: https://digital.nhs.uk/data-and-information/publications/statistical/mi-potential-covid-19-symptoms-reported-through-nhs-pathways-and-111-online/latest
2 - Clinical Commissioning Group to NHS England (Region, Local Office) and NHS England (Region) (April 2019) Lookup in England | Open Geography portal [Internet]. [cited 2020 May 5]. Available from: http://geoportal.statistics.gov.uk/datasets/clinical-commissioning-group-to-nhs-england-region-local-office-and-nhs-england-region-april-2019-lookup-in-england?page=6
3 - McCullagh P, Nelder J. Generalized Linear Models Second edition Chapman & Hall. 1989.
4 - Wallinga J, Lipsitch M. How generation intervals shape the relationship between growth rates and reproductive numbers. Proceedings of the Royal Society B: Biological Sciences. 2007 Feb.274(1609):599–604.
5 - Jombart T, Cori A. Epitrix: Small helpers and tricks for epidemics analysis [Internet]. 2019. Available from: https://CRAN.R-project.org/package=epitrix
6 - Nishiura H, Linton NM, Akhmetzhanov AR. Serial interval of novel coronavirus (COVID-19) infections. International Journal of Infectious Diseases. 2020 Apr.93:284–6.
7 - Statistics » COVID-19 Daily Deaths [Internet]. [cited 2020 May 14]. Available from: https://www.england.nhs.uk/statistics/statistical-work-areas/covid-19-daily-deaths/
8 - R Core Team. R: A language and environment for statistical computing [Internet]. Vienna, Austria: R Foundation for Statistical Computing; 2020. Available from: https://www.R-project.org/