Estimating the effectiveness of routine asymptomatic PCR testing at different frequencies for the detection of SARS-CoV-2 infections
Background: Routine asymptomatic testing using RT-PCR of people who interact with vulnerable populations, such as medical staff in hospitals or care workers in care homes, has been employed to help prevent outbreaks among vulnerable populations. Although the peak sensitivity of RT-PCR can be high, the probability of detecting an infection will vary throughout the course of an infection. The effectiveness of routine asymptomatic testing will therefore depend on how testing and PCR detection varies over time.
Methods: We fitted a Bayesian statistical model to a dataset of twice weekly PCR tests of UK healthcare workers performed by self-administered nasopharyngeal swab, regardless of symptoms. We jointly estimated times of infection and the probability of a positive PCR test over time following infection, then compared asymptomatic testing strategies by calculating the probability that a symptomatic infection is detected before symptom onset and the probability that an asymptomatic infection is detected within 7 days of infection.
Findings: We estimated that the probability that the PCR test detected infection peaked at 77% (95% credible interval (CrI): 54-88%) 4 days after infection, decreasing to 50% (95% CrI: 38-65%) by 10 days after infection. Our results suggest a substantially higher probability of detecting infections 1–3 days after infection than previously published estimates. We estimated that testing every other day would detect 57% (95% CrI: 33-76%) of symptomatic cases prior to onset and 94% (95% CrI: 75-99%) of asymptomatic cases within 7 days if test results were returned within a day.
Interpretation: Our results suggest that routine asymptomatic testing can enable detection of a high proportion of infected individuals early in their infection, provided that the testing is frequent and the time from testing to notification of results is sufficiently fast.
Read the published article here, an earlier preprint here and the supplementary material here.
Download the median and 95% credible interval for our PCR-positivity curve (Figure 3) here and download the median and 95% credible interval for our lateral flow test positivity curve (Figure S3) here
Reproduce our analysis using the code hosted here.
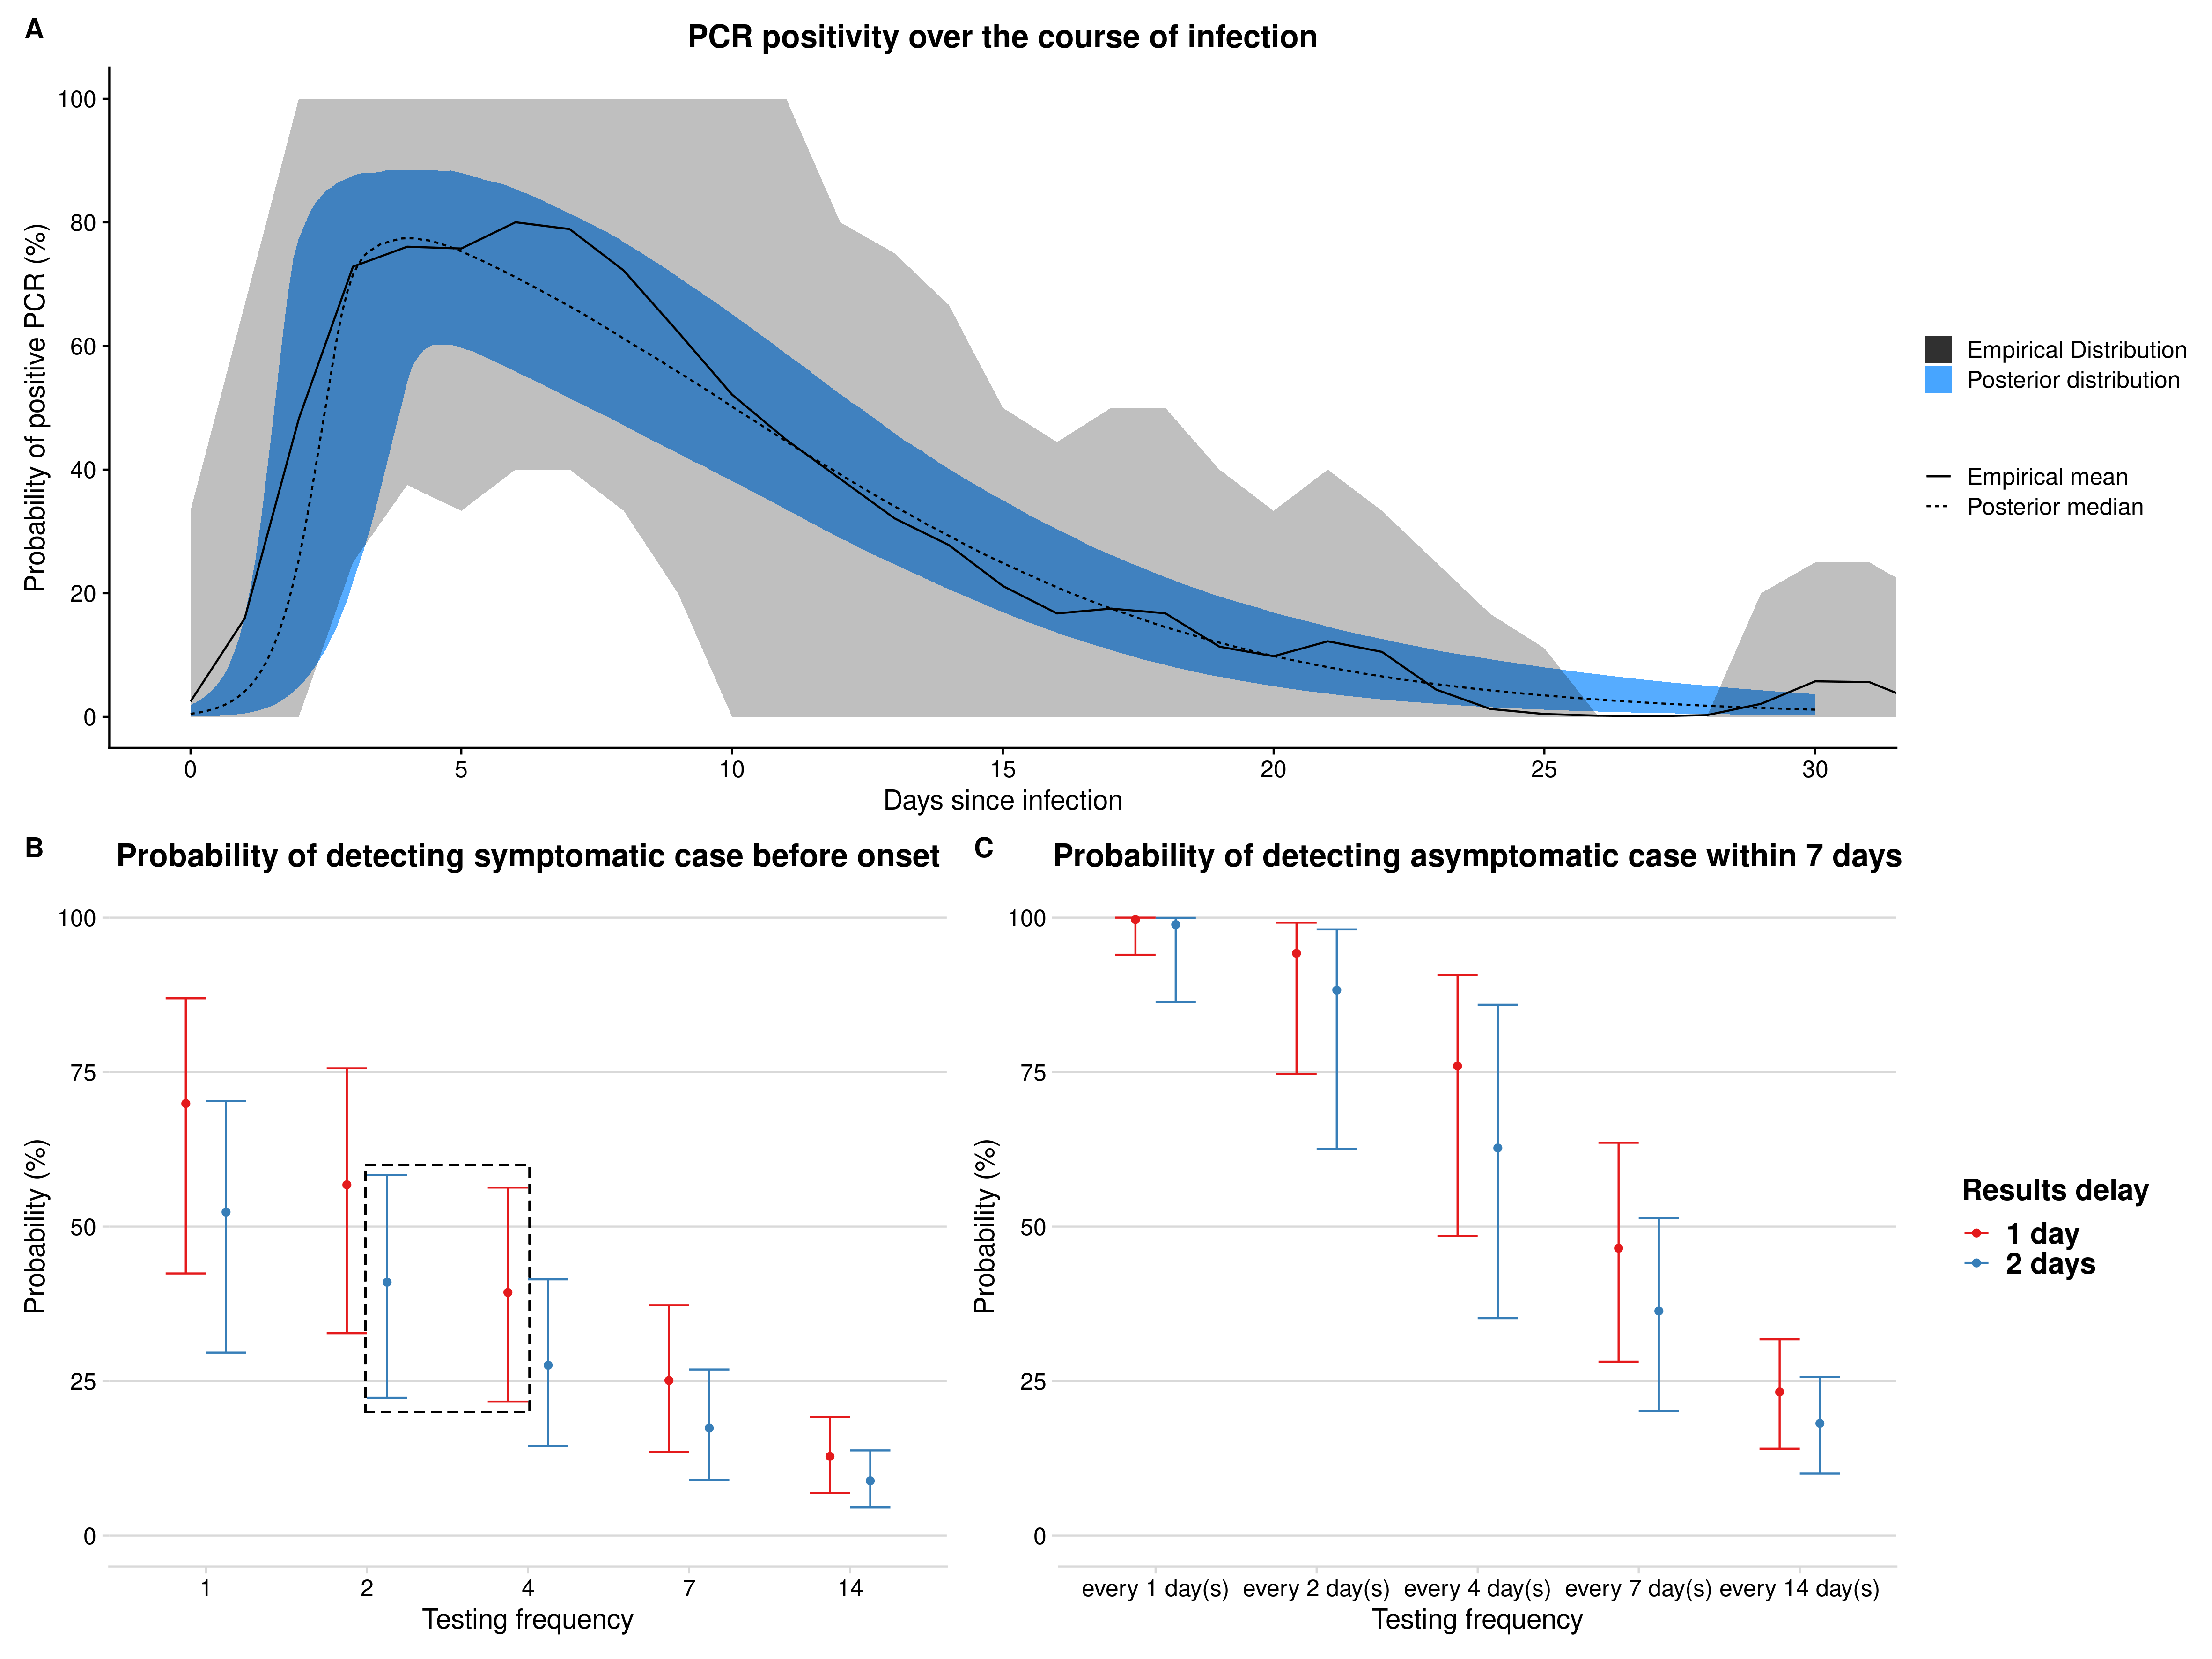 Main result (Figure 3): Estimation of positivity over time, and probability that different testing
frequencies with PCR would detect virus.
Main result (Figure 3): Estimation of positivity over time, and probability that different testing
frequencies with PCR would detect virus.
 Figure 1: Estimation of positivity over time, and probability that different testing
frequencies with PCR would detect virus.
Figure 1: Estimation of positivity over time, and probability that different testing
frequencies with PCR would detect virus.
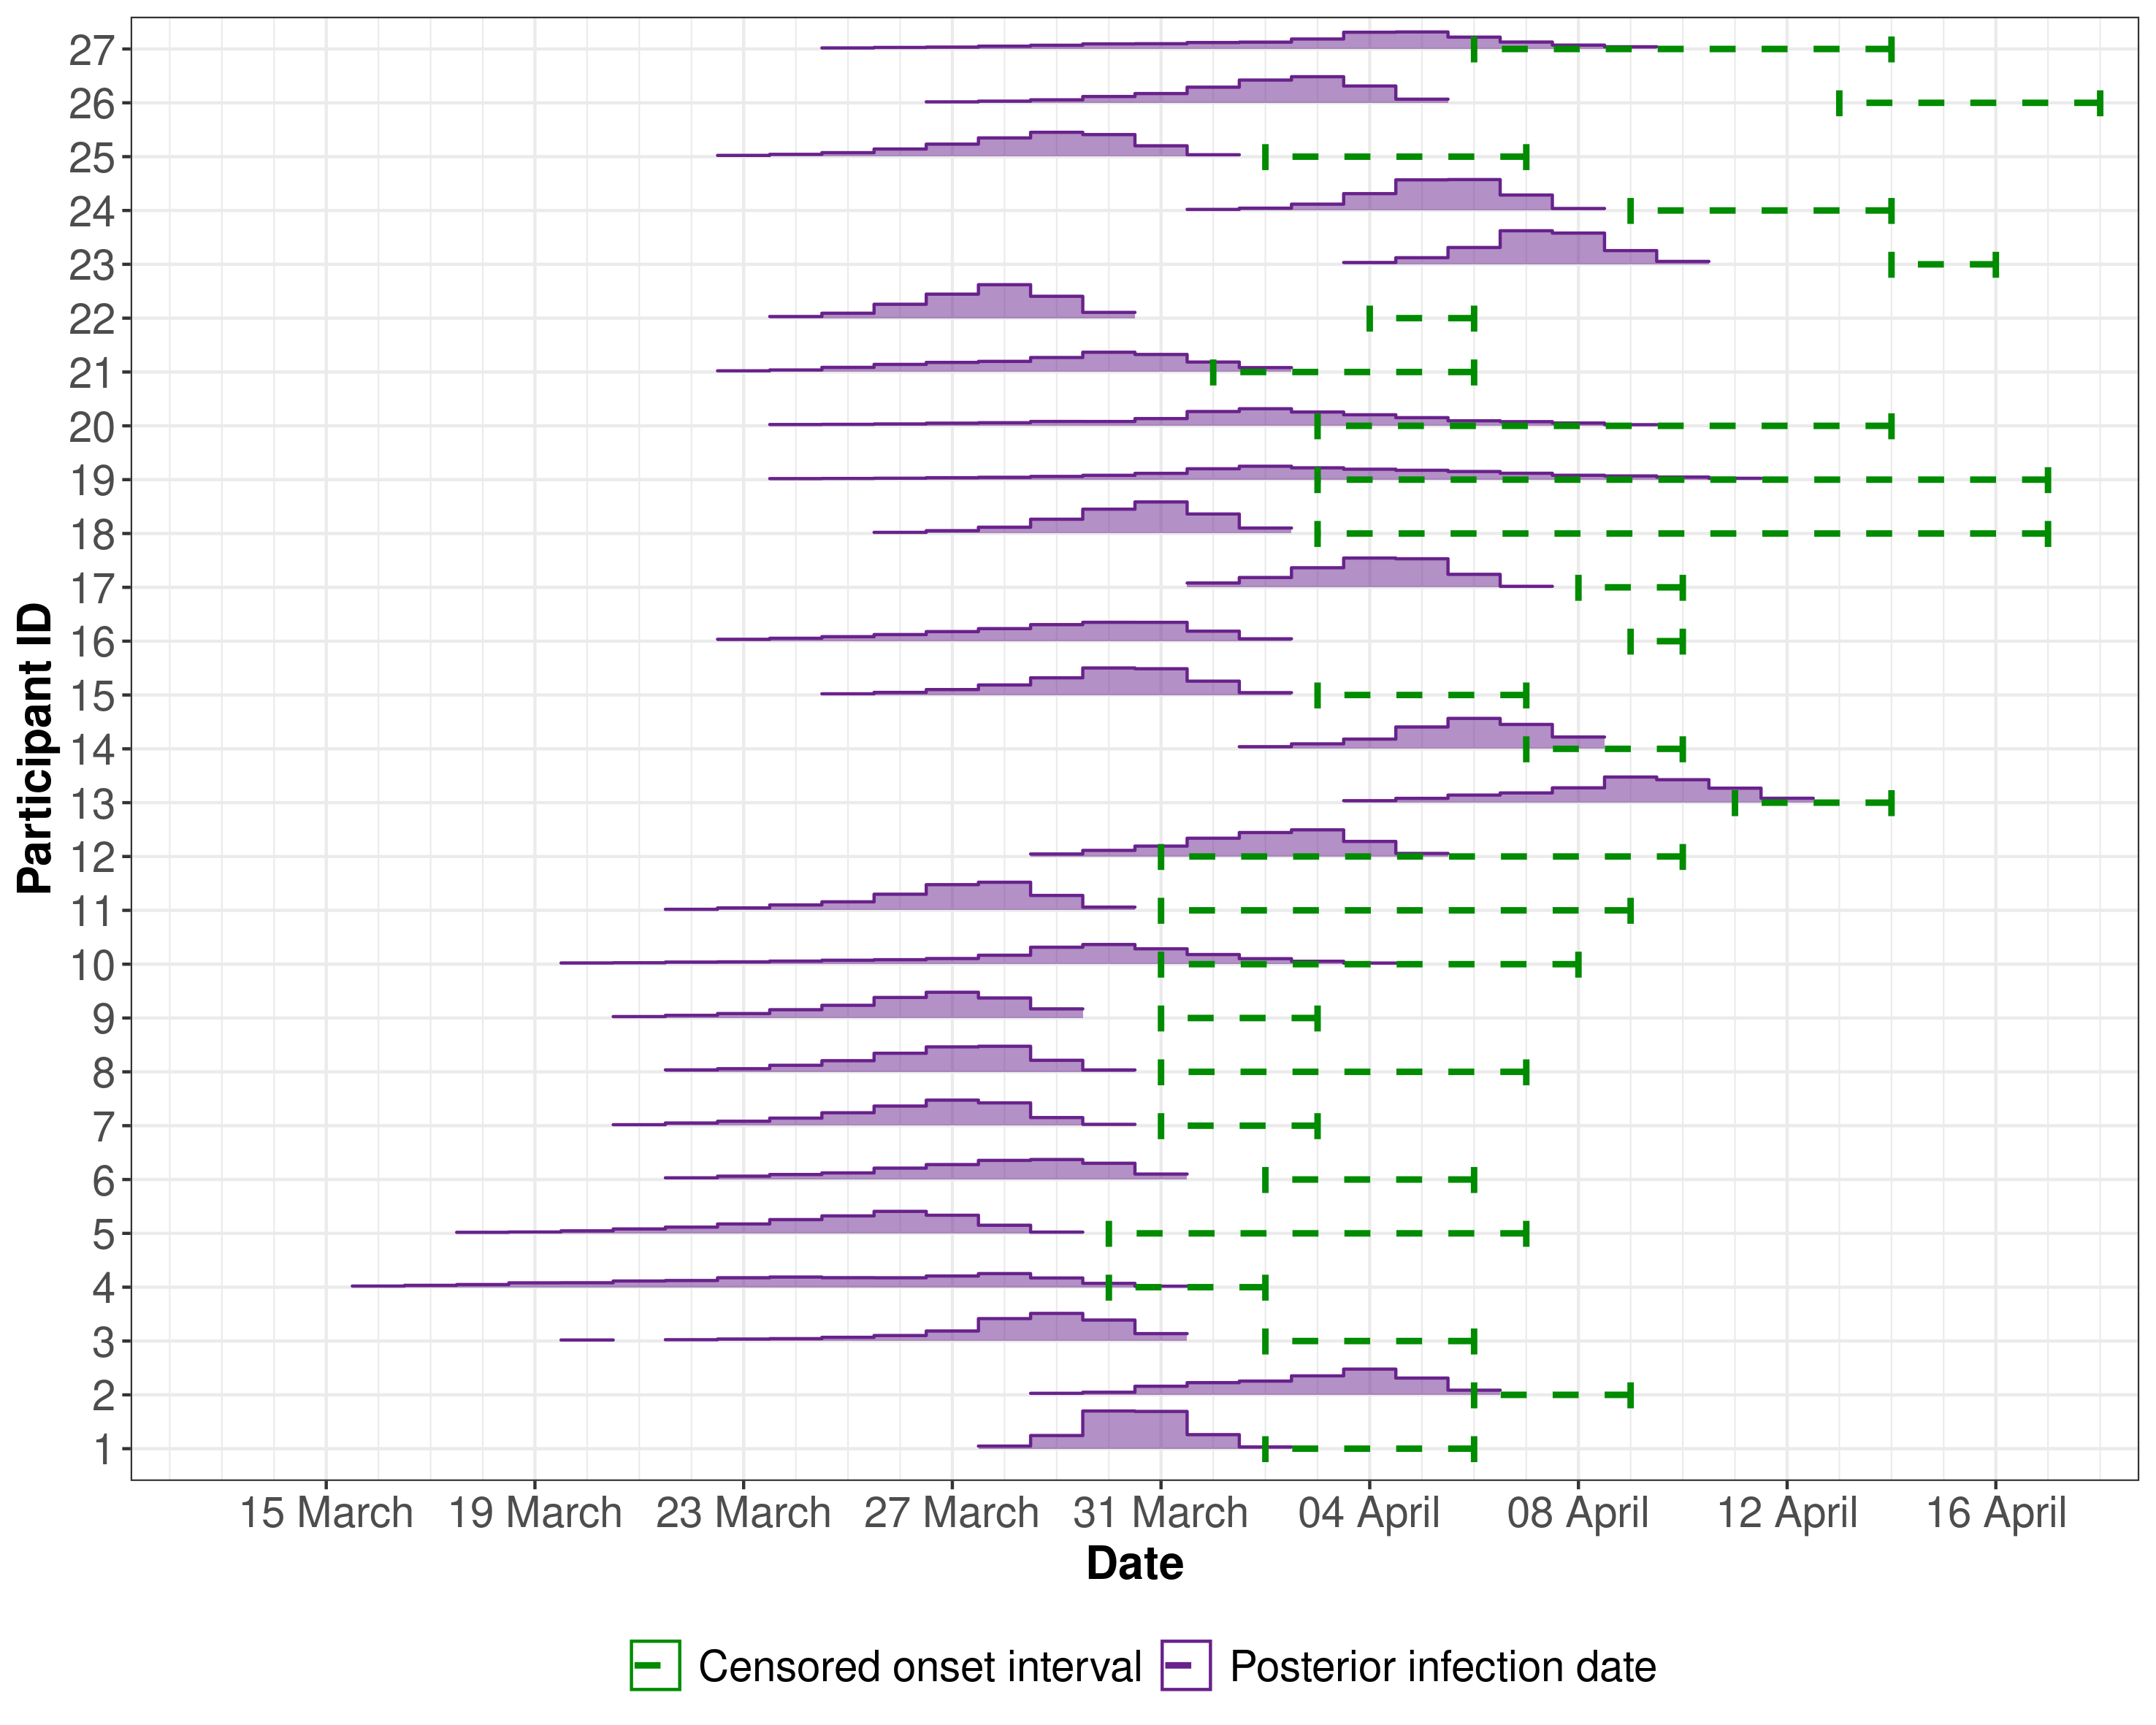 Figure 2: The posterior of the infection time (Ti) of each participant.