SARS-CoV-2 infection and reinfection in a seroepidemiological workplace cohort in the United States
This study has not yet been peer reviewed.
Read the full report here.
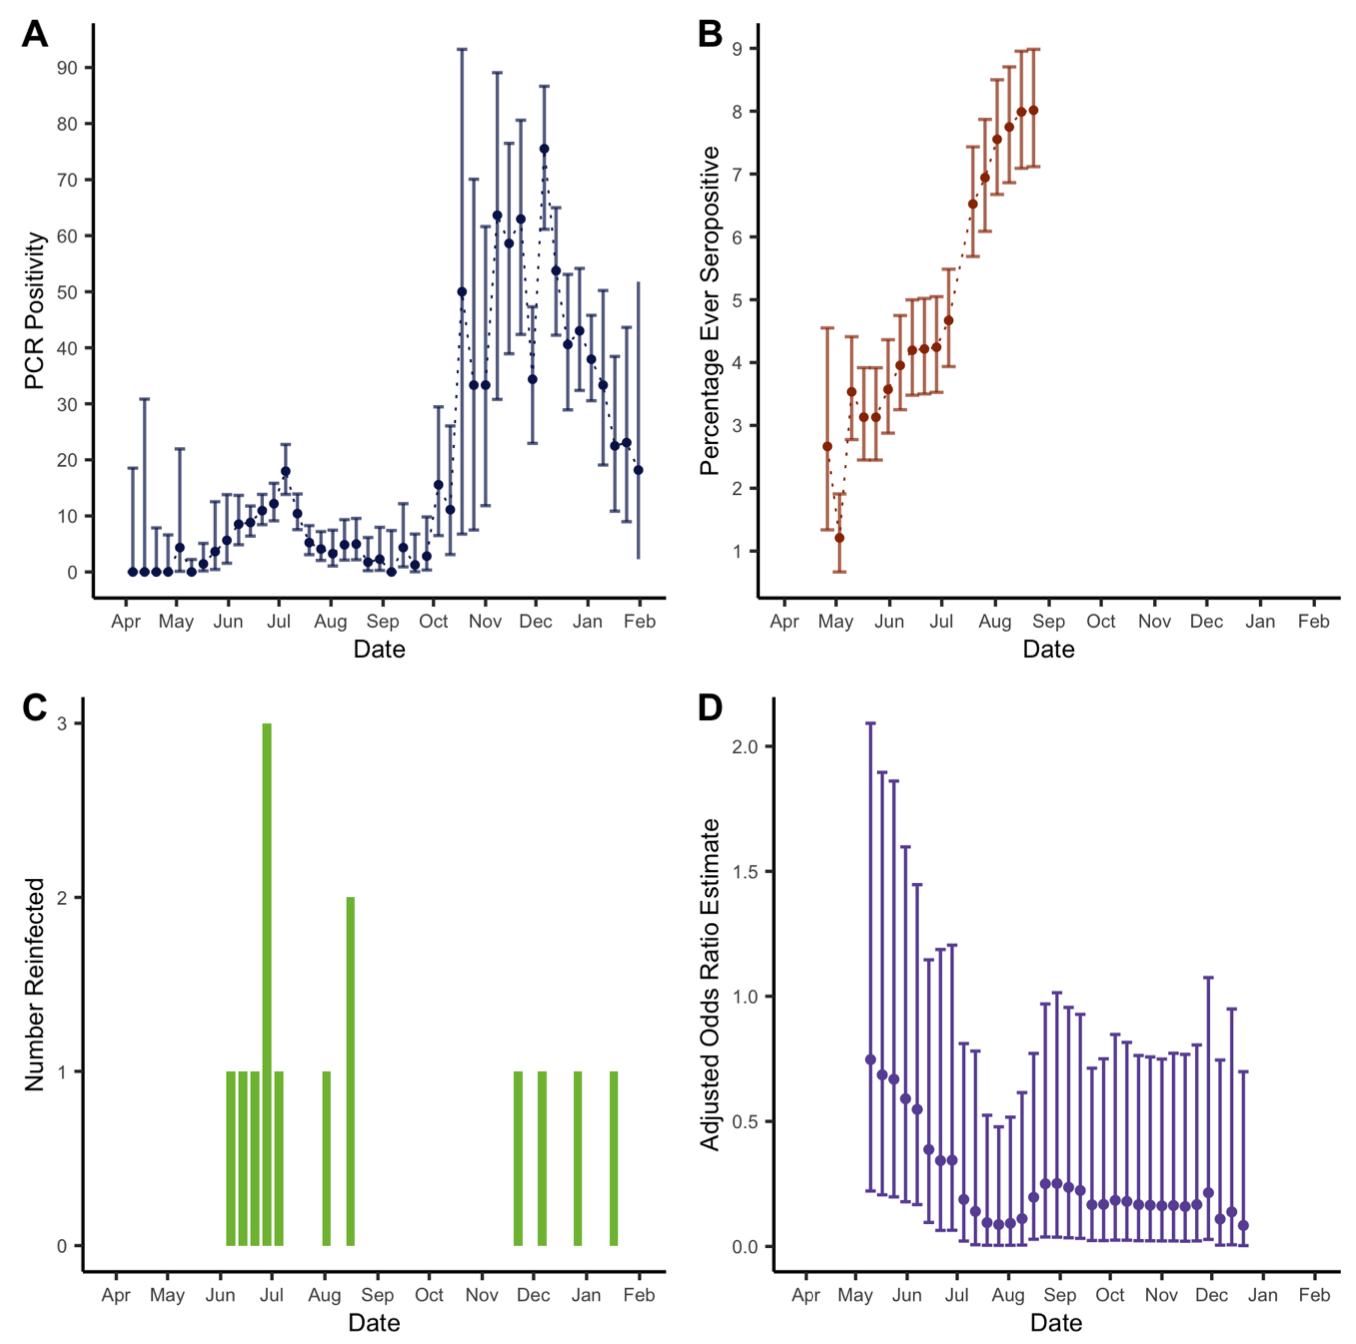
Figure: A) PCR positivity in the cohort between 5th April 2020 and 31st January 2021. B) Percentage ever seropositive in the cohort (number ever seropositive/ cumulative number enrolled) between 29th March 2020 and 23rd August 2020. Note that the percentage ever positive decreases initially as participants continue to be enrolled in the study. C) Number of possible reinfections in cohort over time (defined as a new positive PCR test more than 30 days after initial seropositive result). D) Odds ratio estimates comparing odds of reinfection in the seropositive group with odds of primary infection in the seronegative group, estimated using logistic regression and adjusted for race, ethnicity, state, job category and BMI. The estimates are presented with their associated 95% confidence intervals and with the cut-off week used to define baseline seroprevalence on the x-axis.