Reporting delays and temporal variation in transmission in China during the 2019-nCoV outbreak
This study has not yet been peer reviewed.
- This analysis will be updated with new data as the epidemic progresses. *
Aim
To identify changes in the reproduction number during the course of the outbreak.
Main results
- Delays in confirmation of cases have decreased over time to about 5 days.
- At this point, there is no evidence that transmission is slowing across China.
- Estimates of the basic reproduction number assuming serial intervals as recently reported from the early epidemic (95% confidence): 2.0–3.8.
Limitations
- The estimate of not-yet-confirmed cases to scale up recent numbers is uncertain and relies on the observed delays to confirmation to be representative of all times during the outbreak.
- An apparent recent increase in the reproduction number may be a a result of outdated estimates in the delays from onset to confirmation if cases are now confirmed more rapidly.
- This uses data from across China; both transmissibility and diagnostic capabilities may vary in different parts of the countries, adding uncertainty to the reported numbers.
- The method is robust to under-reporting in general but susceptible to pronounced changes in the proprotion of cases reported; recent media attention could, for example, have led to changes in healthcare-seeking that make our estimates invalid.
Methods
We corrected the reported number of confirmed cases reported from China by onset date in order to account for censoring, i.e. cases that have not been confirmed yet but will show up in the data at later times. We did this by using the empirical distribution of reporting delays from a linelist of cases compiled from public reports [1]. We randomly sampled the true number of cases (including those not yet confirmed) assuming that the reported number of cases is drawn from a binomial distribution, where each case has independent probability pi of being confirmed yet, where i is the number of days of the symptom onset before the report cut-off date, and pi the empirical cumulative distribution of cases that are confirmed by day i after they develop symptoms.
We used the inferred number of cases to estimate the reproduction number on each day using the EpiEstim R package [2]. This uses a combination of the serial interval distribution and the number of observed cases to estimate the reproduction number at each time point [4,5]. We smoothed the estimates with a two-day time window. We tested three scenarios for the serial interval distribution: according to esimates from the early epidemic, with a mean of 7.5 days and standard deviation of 3.4 days [6]; SARS-like, with a mean of 8.4 days and standard deviation of 3.8 days [7]; and MERS-like, with a mean of 6.8 days and standard deviation of 4.1 days [8].
Results
Confirmation delays
The mean delay from onset to confirmation is 5.6 days. There is some indication that this delay has declined over time. In particular, there may have been a surge of confirmations, possibly a long time since onset, after the National Health Commission Task Force visited Wuhan [9]. Because of this, we only used onset dates after 21 January in the further analysis, with a mean of 5.
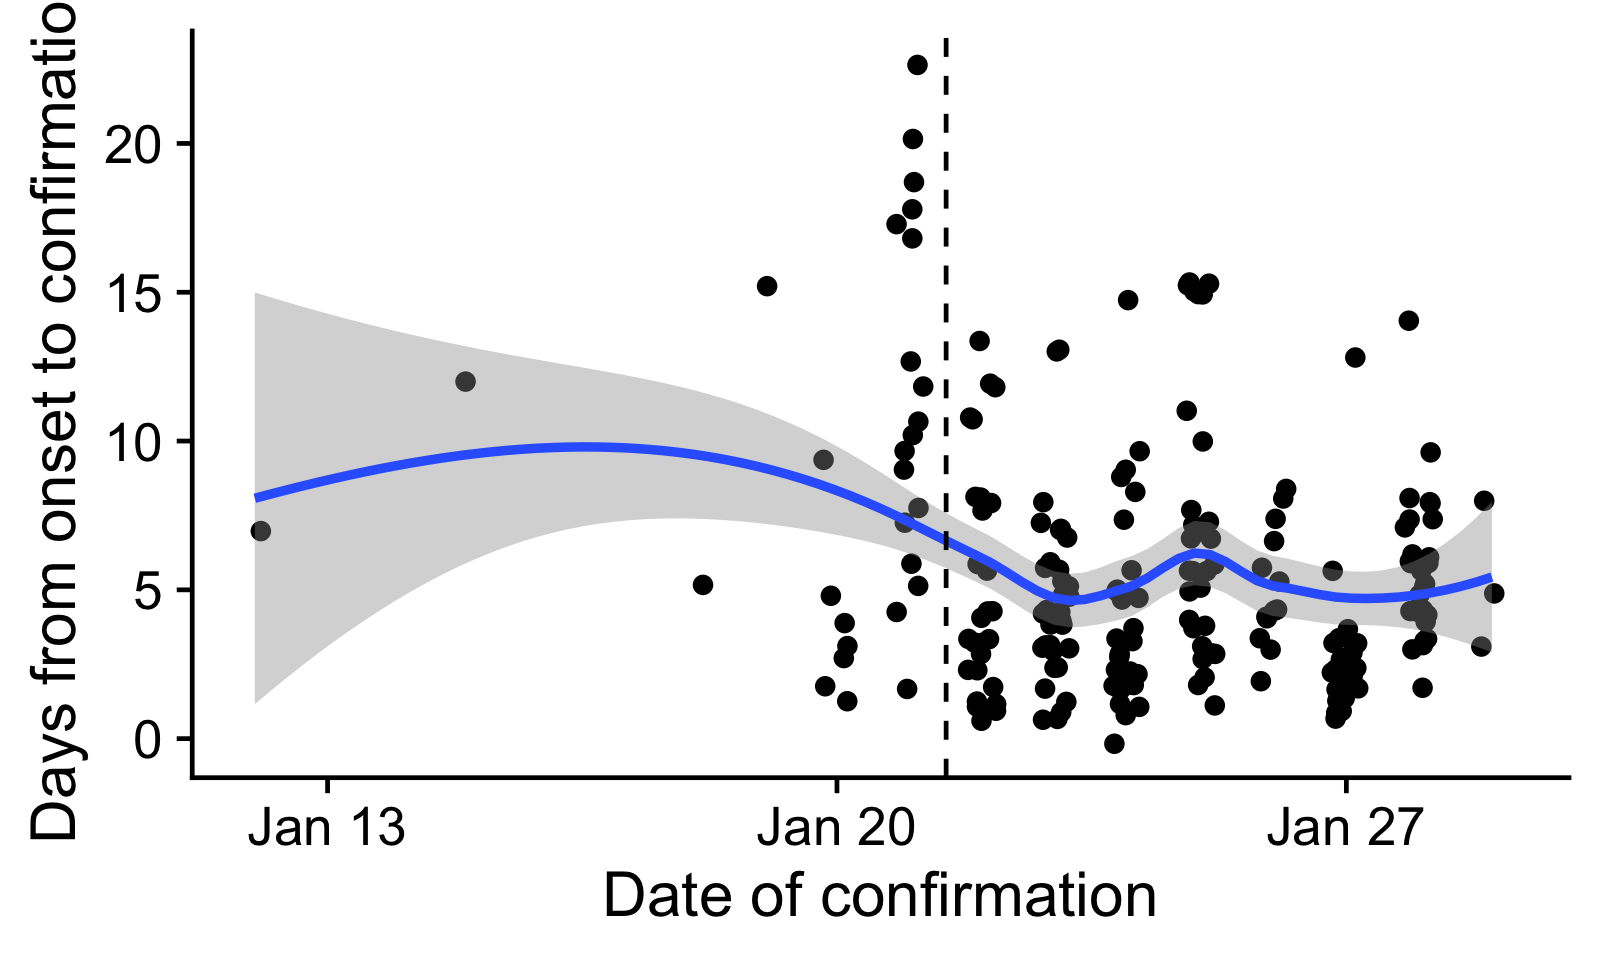
Figure 1: Delays from onset to confirmation, by date of confirmation.
Every dot is one reported case with onset and confirmation dates
reported. The blue line indicates a loess-smoothed trend. We only used
confirmation delays to the right of the dashed line in the further
analysis.
Adjusting the number of reported cases for confirmation delays
Since only 10% of cases have been confirmed within a day, 43% within 3 days and 64% within 5 days, we are estimating that there is a significant backlog of cases that will eventually be confirmed but has yet to be reported. These estimates are to be taken with caution as they would overestimate the true number of cases if the delays to confirmation have been reduced over the past few days.
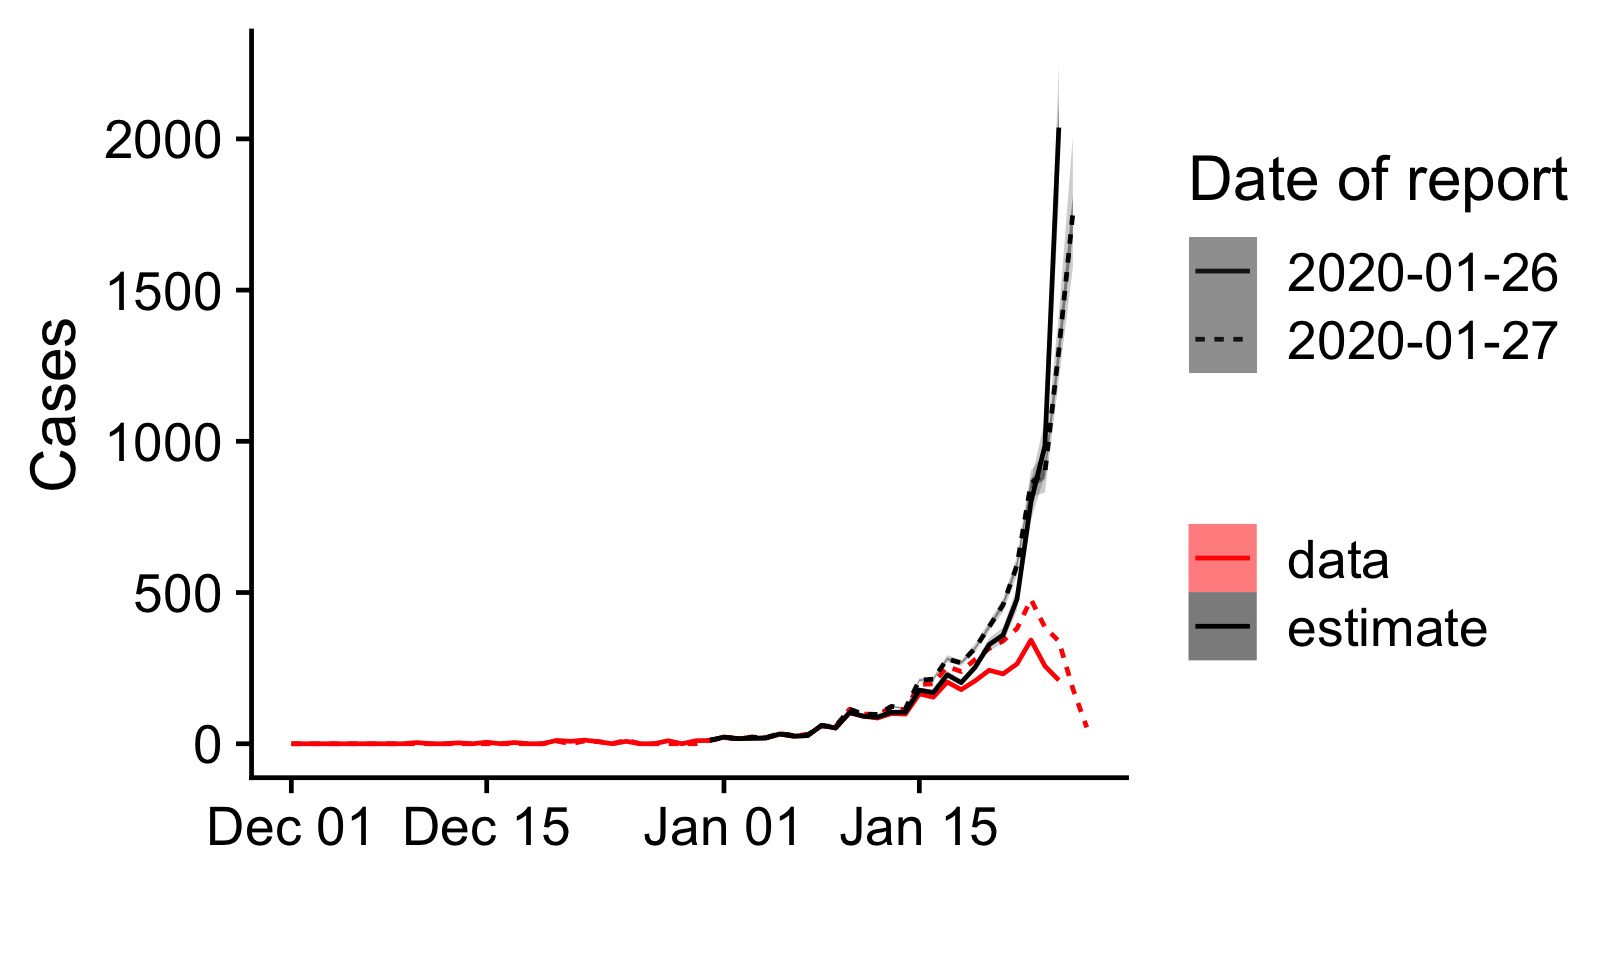
Figure 2: Number of confirmed cases by date of onset as reported
in two subsequent reports by the China Center for Disease Control and
Prevention [10,11] (red), and as estimated accounting for reporting
delays (black). The dates given as date of report are the cut-off dates
for cases in the reports.
Time-varying reproduction number
In the time-varying reproduction number, we see differences depending on the serial interval distribution used. With a serial interval as estimated in the early epidemic the latest estimate of the basic reproduction number is . There is no apparent downward trend in the reproduction number. There seems to be a recent uptick in the reproduction number. This may be an artifact of the adjustment to confirmation delays, especially if cases are being confirmed more recently than we assumed here.
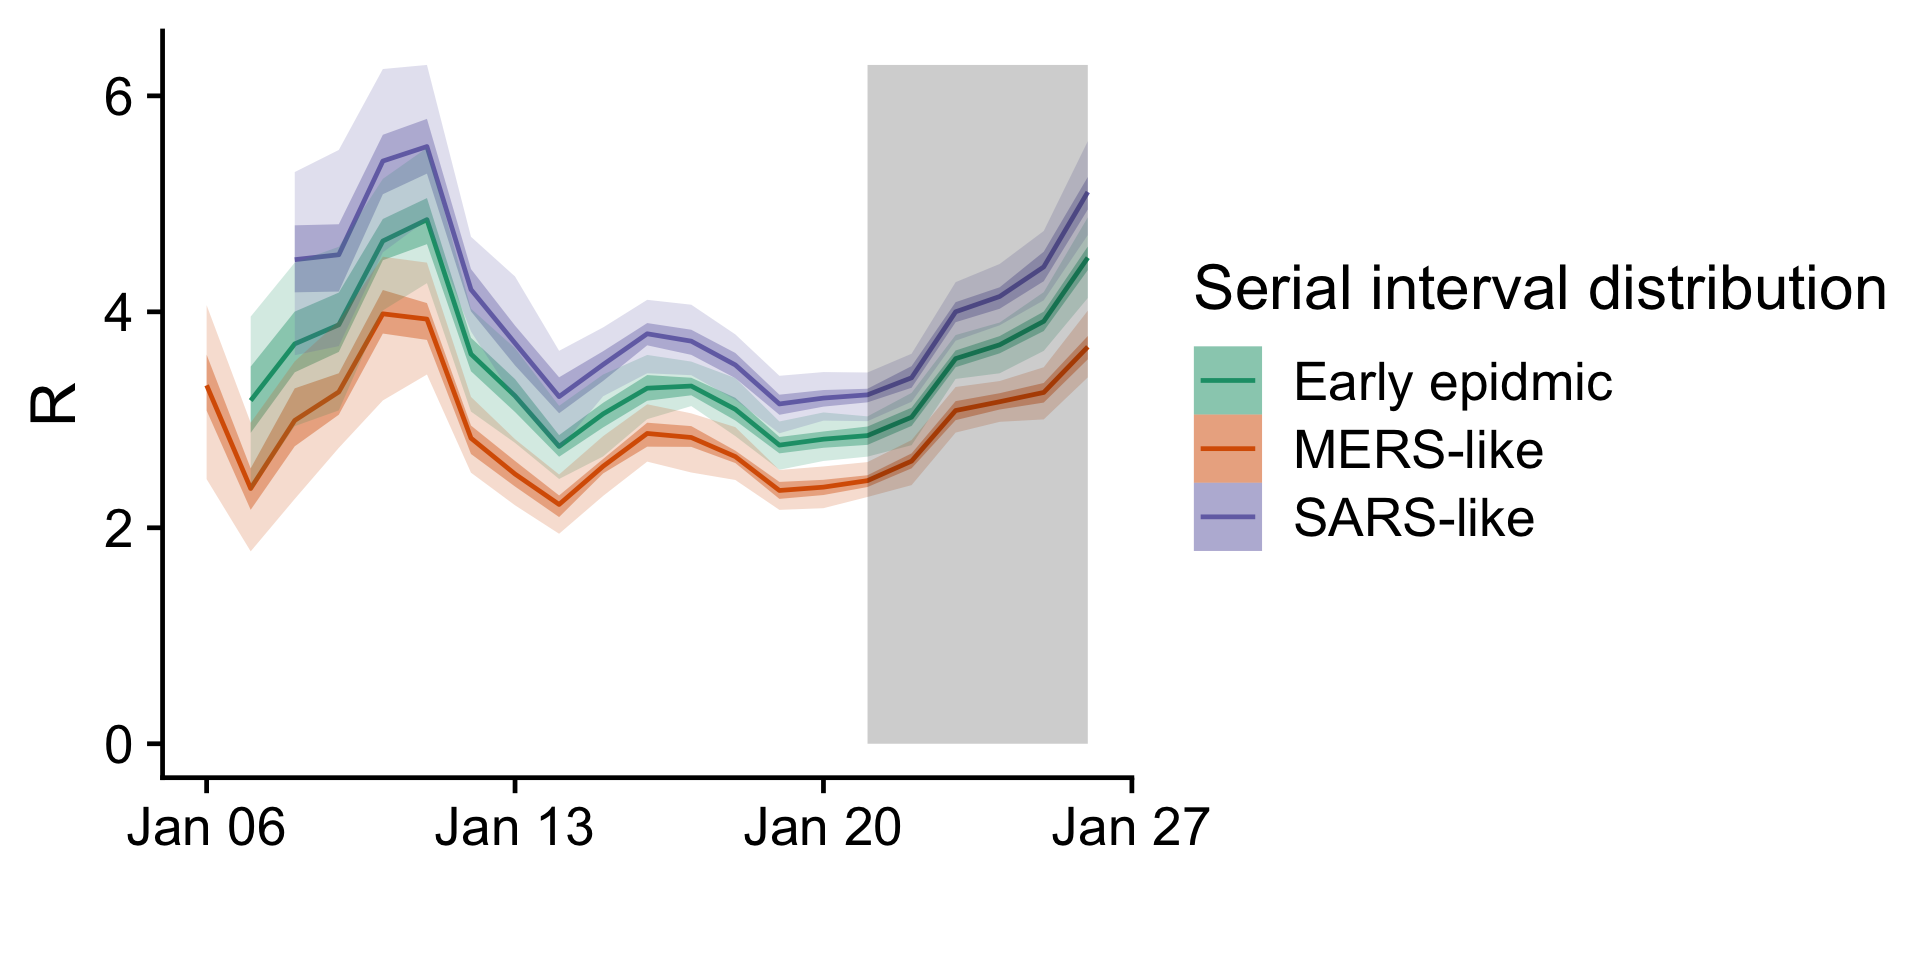
Figure 3:
Time-varying reproduction number for different assumed serial interval
distributions. The grey shading indicates the time period where cases
are scaled up by more than 50% to account for delays in confirming
cases; this area should be considered highly uncertain.
References
1 Xu B, Gutierrez B, Hill S et al. Epidemiological Data from the nCoV-2019 Outbreak: Early Descriptions from Publicly Available Data. 2020.
2 Cori A. EpiEstim: Estimate time varying reproduction numbers from epidemic curves. 2019. https://CRAN.R-project.org/package=EpiEstim
3 R Core Team. R: A language and environment for statistical computing. Vienna, Austria:: R Foundation for Statistical Computing
4 Cori A, Ferguson NM, Fraser C et al. A New Framework and Software to Estimate Time-Varying Reproduction Numbers During Epidemics. American Journal of Epidemiology 2013;178:1505–12. doi:10.1093/aje/kwt133
5 Wallinga J, Teunis P. Different Epidemic Curves for Severe Acute Respiratory Syndrome Reveal Similar Impacts of Control Measures. American Journal of Epidemiology 2004;160:509–16. doi:10.1093/aje/kwh255
6 Li Q, Guan X, Wu P et al. Early transmission dynamics in wuhan, china, of novel coronavirus–infected pneumonia. New England Journal of Medicine;0:null. doi:10.1056/NEJMoa2001316
7 Lipsitch M. Transmission Dynamics and Control of Severe Acute Respiratory Syndrome. Science 2003;300:1966–70.
8 Cauchemez S, Nouvellet P, Cori A et al. Unraveling the drivers of mers-cov transmission. Proceedings of the National Academy of Sciences 2016;113:9081–6. doi:10.1073/pnas.1519235113
9 Wu P, Hao X, Lau EHY et al. Real-time tentative assessment of the epidemiological characteristics of novel coronavirus infections in wuhan, china, as at 22 january 2020. Eurosurveillance 2020;25. doi:https://doi.org/10.2807/1560-7917.ES.2020.25.3.2000044
10 Epidemic update and risk assessment of 2019 novel coronavirus. 27 january, 2020. http://www.chinacdc.cn/jkzt/crb/zl/szkb_11803/jszl_11811/202001/P020200127544648420736.pdf
11 Epidemic update and risk assessment of 2019 novel coronavirus. 28 january, 2020. http://www.chinacdc.cn/yyrdgz/202001/P020200128523354919292.pdf