Model fitting of early 2020 increase in burials in Mogadishu (Somalia) suggests possible early introduction of SARS-CoV-2
The published version is available here.
Background
In countries with weak surveillance systems confirmed COVID-19 deaths are likely to underestimate the death toll of the pandemic. Many countries also have incomplete vital registration systems, hampering excess mortality estimation, necessitating the use of alternative data sources of mortality. We obtained satellite imagery data of the main cemeteries of Mogadishu (Somalia), which showed a sustained rise in burials above the pre-pandemic baseline in the period February-July 2020. We fitted a dynamic transmission model to this indirect measure of excess mortality to estimate the date of introduction and transmissibility of SARS-CoV-2, as well as the effect of non-pharmaceutical interventions in this low-income, crisis-affected setting.
Methods
We performed Markov chain Monte Carlo (MCMC) fitting with an age-structured compartmental COVID-19 model to provide median estimates and credible intervals for the date of introduction, the basic reproduction number (R0) and the effect of non-pharmaceutical interventions in Mogadishu up to September 2020.
Results
Under the assumption that excess deaths in Mogadishu February-September 2020 were directly attributable to SARS-CoV-2 infection we arrived at median estimates of October-November 2019 for the date of introduction and low R0 estimates (1.3-1.5) stemming from the early and slow rise of excess deaths and their long plateau. The effect of control measures on transmissibility appeared small or moderate (below 30%).
Conclusions
Subject to study assumptions, a very early SARS-CoV-2 introduction event may have occurred in Somalia. Estimated transmissibility in the first epidemic wave was lower than observed in European settings.
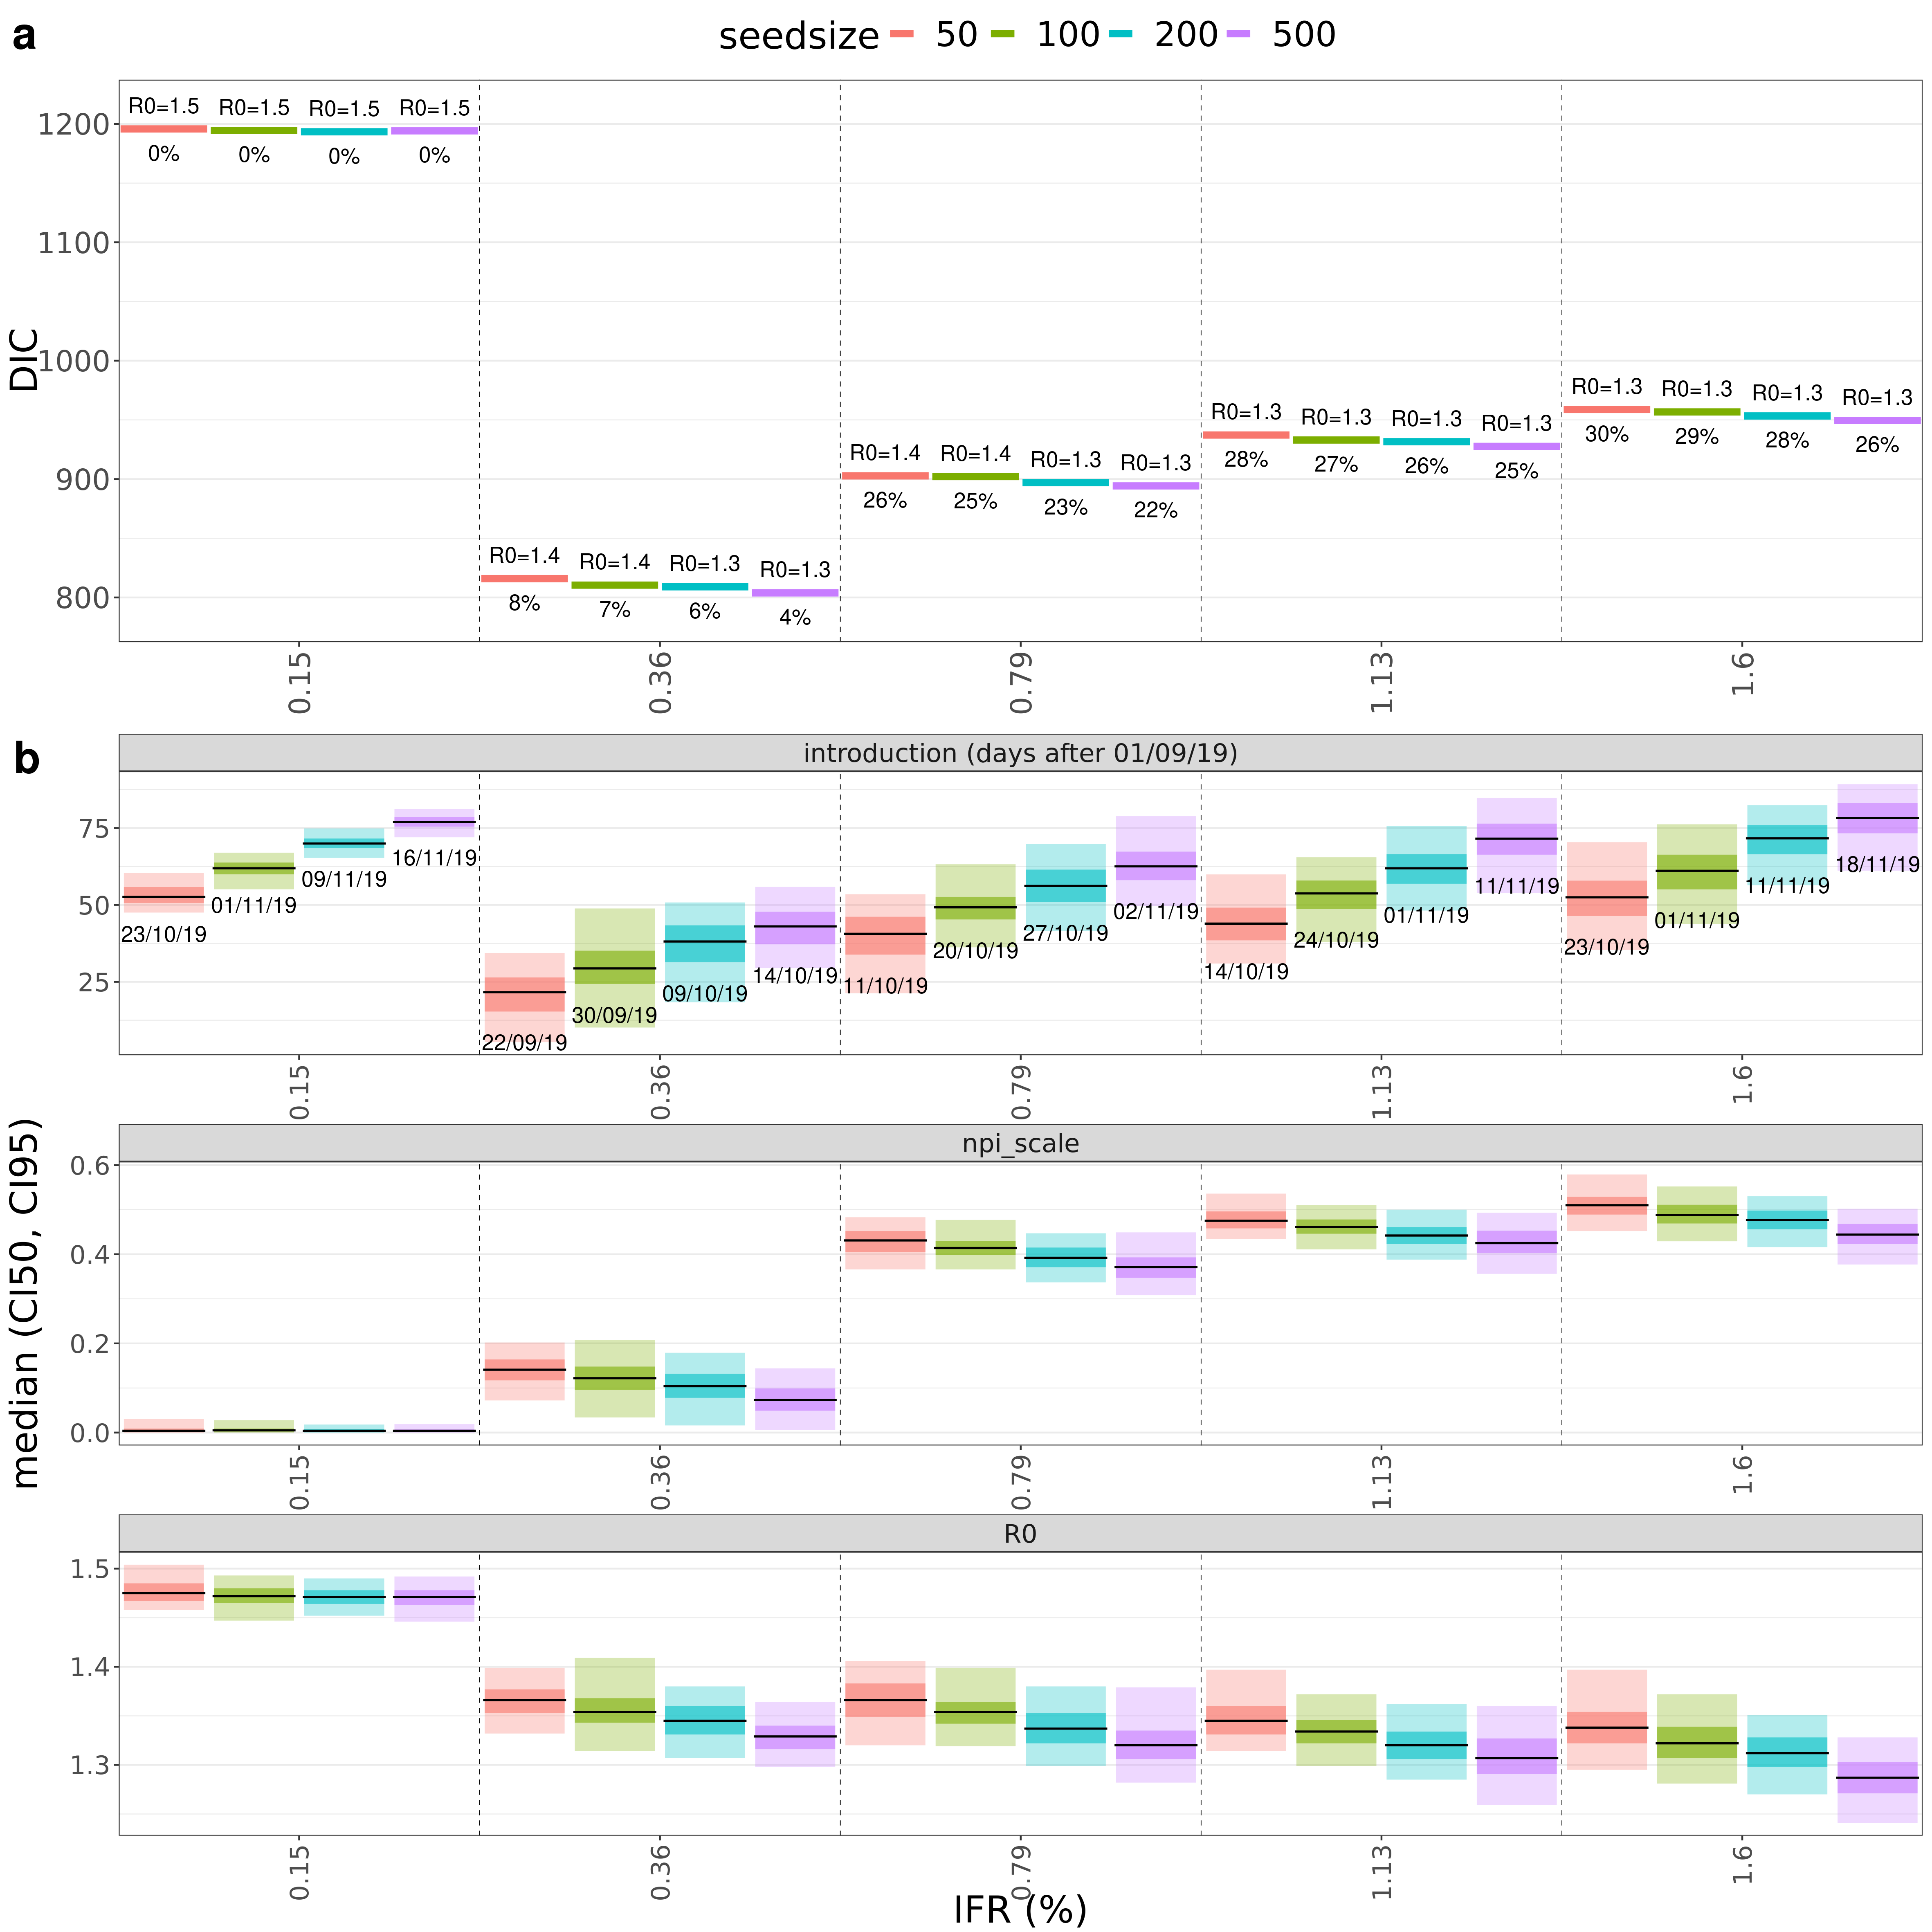
a. Quality of fits for different infection fatality ratios and seed sizes
Goodness of fit as measured by DIC (deviance information criterion) at different values of seed size and population-wide IFR. The labels above the colored lines show median estimates for R0 and the date of introduction, and the NPI-induced reduction in transmissibility during the first NPI period below.
b. Estimates of date of introduction, R0 and scaling factor for NPI stringency index
Median values and credible intervals for the fitting parameters (introduction date, NPI_scale, R0) and quality of fits at different assumed values of the infection fatality ratio (x-axis) and seed size (colors). In the top panel, labels below the lines show median estimates of the date of introduction. Shaded areas around the median (black) are 50% (darker) and 95% credible intervals.
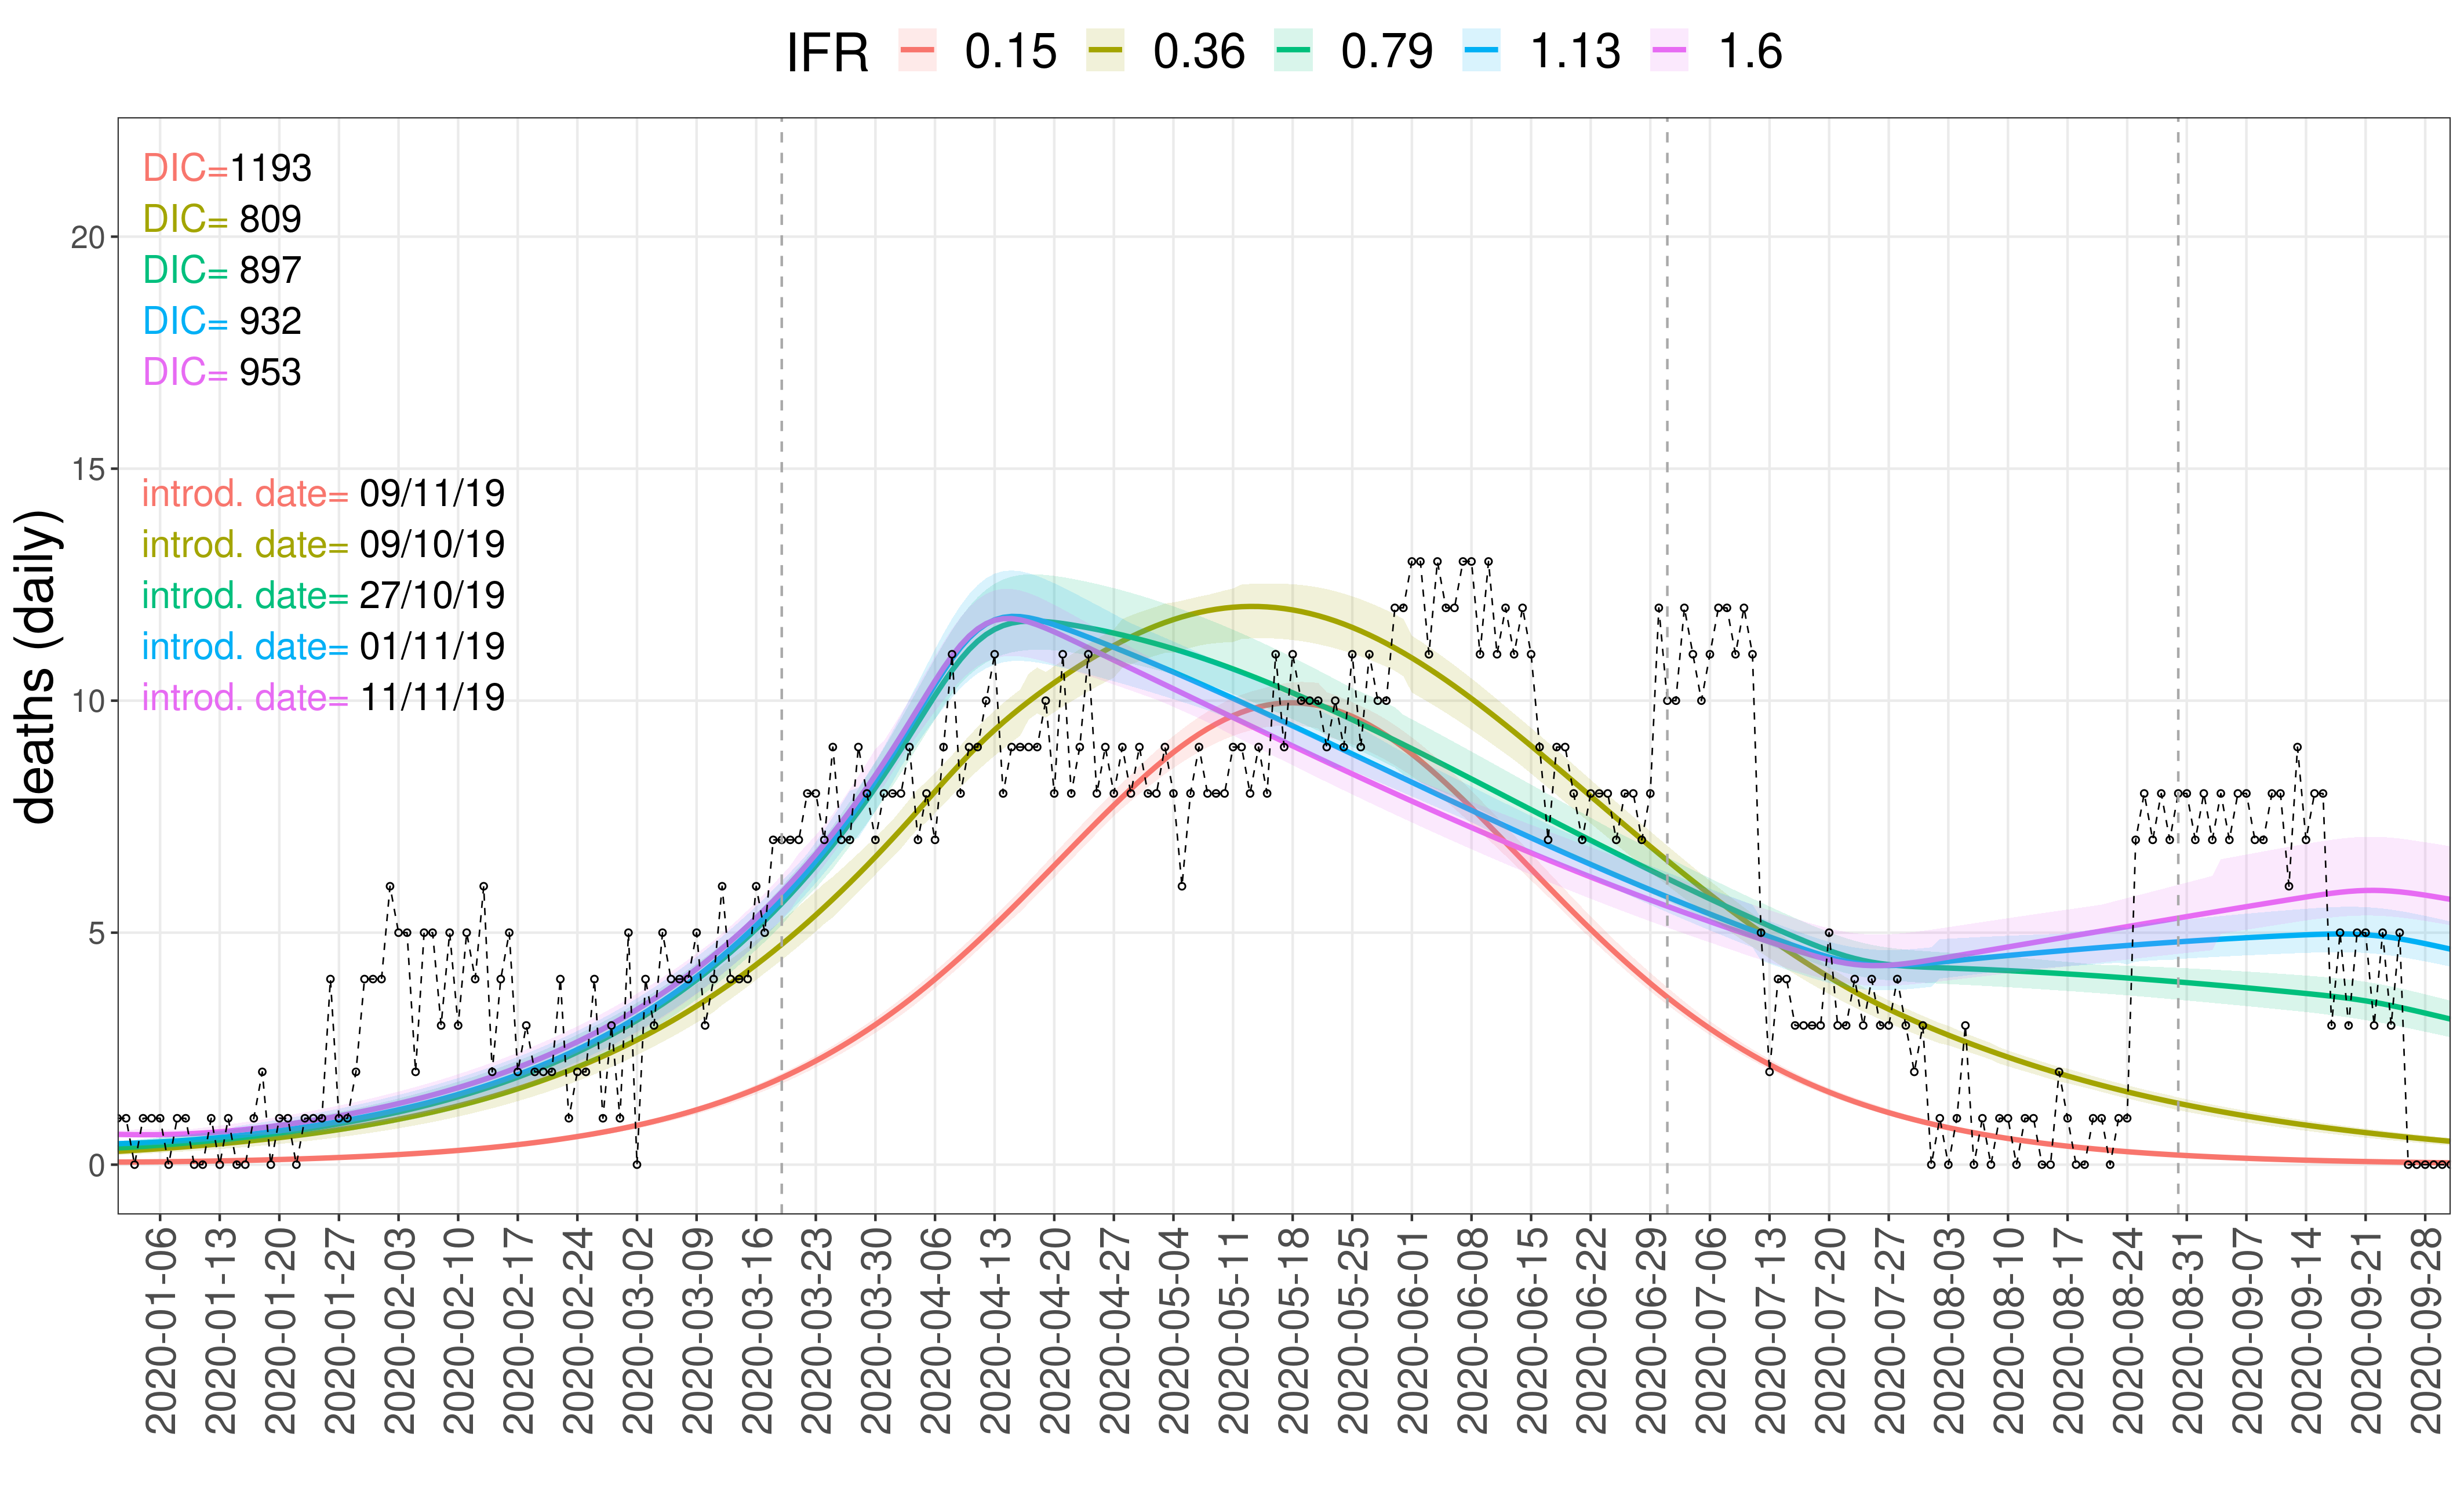
Simulated deaths compared to burial data
Dynamics generated by sampling the posterior distributions of fitting parameters, at a seed size of 200 and four IFR values from 0.15% to 1.13%. The best fit (lowest DIC value) is at IFR=0.36%. The dashed black line and circles show the daily number of excess burials. Only the period from 23 February to 24 August was used for fitting.
Read the pre-print here. Accompanying code can be found here.